
Figure 1.
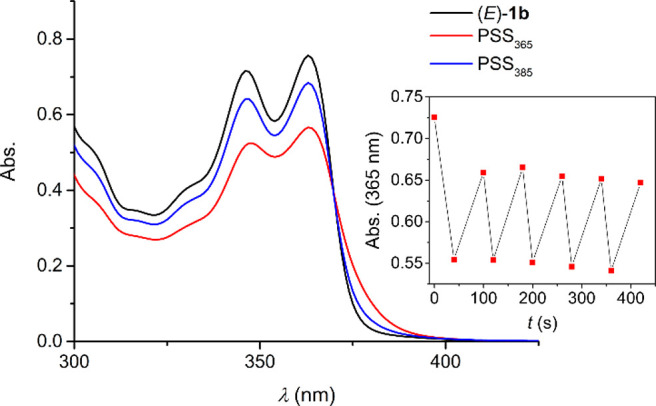
UV–vis spectrum of (E)-1b in degassed DMSO (2.5 × 10⁻⁴ M) and spectra obtained upon 365 and 385 nm irradiation. The inset shows the absorption change (at 365 nm) upon multiple cycles.
Official websites use .gov
A
.gov website belongs to an official
government organization in the United States.
Secure .gov websites use HTTPS
A lock (
) or https:// means you've safely
connected to the .gov website. Share sensitive
information only on official, secure websites.
UV–vis spectrum of (E)-1b in degassed DMSO (2.5 × 10⁻⁴ M) and spectra obtained upon 365 and 385 nm irradiation. The inset shows the absorption change (at 365 nm) upon multiple cycles.