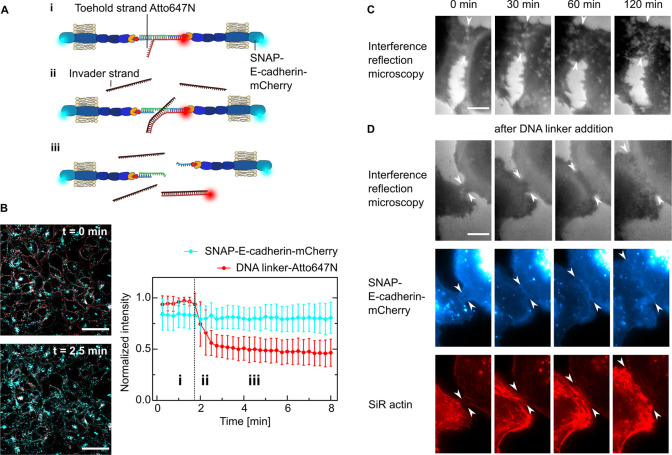
Figure 2.
Dynamic control of cell–cell adhesion. (A) Sketch showing the reversibility of the cell–cell linkage by using toehold-mediated strand-displacement. A431D cells are linked with a DNA strand which contains a free overhang (toehold) functionalized with Atto647N (i). Upon addition of an invader strand in excess (ii), the linker strand is displaced and the link between the cells is broken (iii). (B) Representative confocal images of cells expressing SNAP-E-cadherin-mCherry (cyan) incubated with the DNA linker-Atto647N (red) before and after the addition of the invader strand. Scale bar, 50 μm. Quantification of the fluorescence intensity normalized to the maximum value over time of SNAP-E-cadherin-mCherry and DNA linker-Atto647N. The invader strand is added at t = 1.8 min, indicated by the dotted line. Mean values are plotted and error bars indicate the standard deviation. Plots generated from N = 3 independent experiments and n = 31 measurements. (C) Live-cell time-lapse snapshots of A431D cells expressing SNAP-E-cadherin-mCherry imaged by interference reflection microscopy without addition of the DNA linker. Images representative of N = 2 independent experiments. Scale bar, 10 μm. (D) Live-cell time-lapse snapshots showing the formation of a cell–cell junction between A431D cells expressing SNAP-E-cadherin-mCherry after the addition of the DNA linker: top row, interference reflection microscopy; middle row, SNAP E-cadherin (blue); bottom row, actin cytoskeleton labeled with SiR actin (red). Images are representative of N = 2 independent experiments. Scale bar, 10 μm.

