Figure 4.
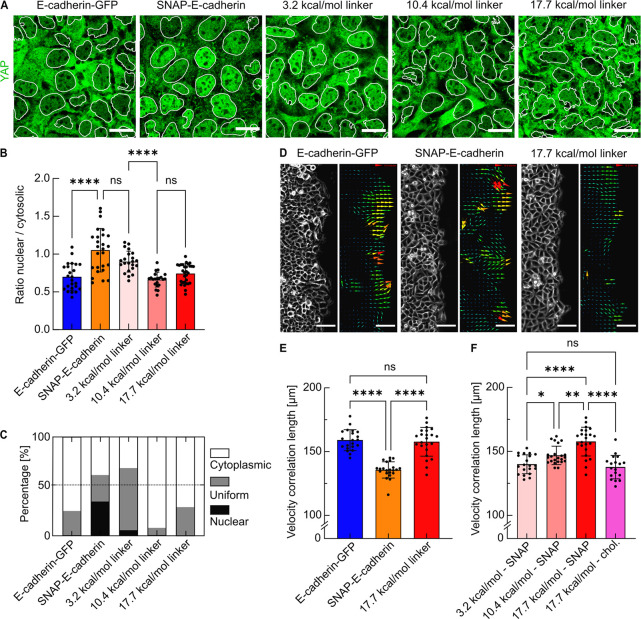
Effect of the DNA linker on cell–cell signaling and epithelial collective dynamics. (A) Confocal images showing YAP (green) with the nuclear segmentation (white outlines) for cells expressing E-cadherin-GFP or SNAP-E-cadherin after the incubation with DNA linkers of different hybridization strengths (3.2, 10.4, or 17.7 kcal/mol). Scale bars, 20 μm. (B) Quantification of the nuclear--to-cytosolic intensity ratios r of YAP. Each data point represents one field of view containing 25–30 cells. Bars show the means; error bars are standard deviations. (C) Quantification of the subcellular localization of YAP classified according to the ratios r between nuclear and cytosolic YAP intensities. Nuclear, r ≥ 1.15; uniform, r > 0.85; cytosolic, r ≤ 0.85. N ≥ 3, data derived from n(E-cadherin-GFP) = 24 measurements, n(SNAP-E-cadherin) = 25, n(SNAP-E-cadherin +3.2 kcal/mol linker) = 22, n(SNAP-E-cadherin +10.4 kcal/mol linker) = 21, n(SNAP-E-cadherin +17.7 kcal/mol linker) = 29. (D) Brightfield and vector fields generated by particle image velocimetry (PIV) of the migration front of A431D cells expressing E-cadherin-GFP, SNAP-E-cadherin, or SNAP-E-cadherin incubated with the 17.7 kcal/mol DNA linker. Scale bars, 100 μm. (E) Comparison of the velocity correlation lengths between migrating cells. Every data point shows the average correlation length of one field of view from t = 3. Five hours to t = 7.3 h after removing the confinement, corresponding to 24 time points. nFOV shows the number of analyzed fields of view from at least three independent experiments. nFOV(E-cadherin-GFP) = 21, nFOV(SNAP-E-cadherin) = 22, nFOV(SNAP-E-cadherin + DNA linker) = 23. (F) Velocity correlation length for the variation of the DNA hybridization strength (3.2, 10.4, or 17.7 kcal/mol) as well as the anchoring method (SNAP-E-cadherin or direct functionalization of the anchor strand with cholesterol). N ≥ 3, nFOV(3.2 kcal/mol - SNAP) = 19, nFOV(10.4 kcal/mol - SNAP) = 23, nFOV(17.7 kcal/mol - SNAP) = 23 (same data set as in (E) shown again for better comparability), nFOV(17.7 kcal/mol - chol) = 18. ns = no significance. (*) p-value between 0.1 and 0.01. (**) p-value between 0.01 and 0.001. (****) p-value < 0.0001. Multiple ANOVA tests with Welch’s correction. Alpha was set to 0.05.

