Figure 2.
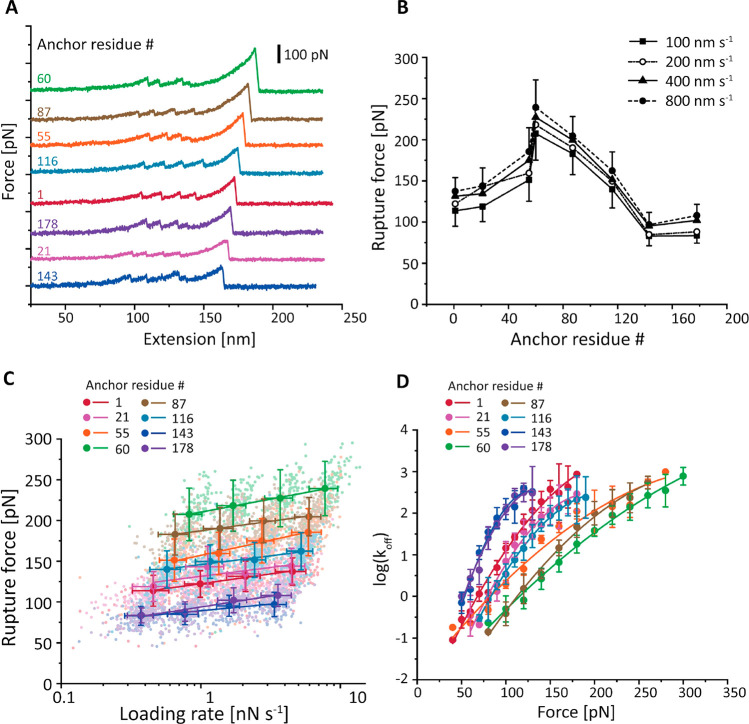
Dependency of anticalin:CTLA-4 complex stability on anticalin anchor position. (A) Example AFM force–extension traces measured with eight different pulling geometries. Each trace shows unfolding of two FLN fingerprint domains and rupture of the anticalin:CTLA-4 complex for a given anchor residue on anticalin. (B) Most probable rupture forces of the anticalin:CTLA-4 complex at various pulling speeds were plotted against the anchor residue number on anticalin. Error bars represent the standard deviation of rupture forces measured at 100 nm s–1 (minus) and 800 nm s–1 (plus) pulling speeds. (C) Most probable rupture forces measured at different pulling speeds were plotted against the logarithm of average loading rate and fitted linearly to extract the zero-force off rate k0 and distance to the transition state Δx⧧. Error bars represent the standard deviation of rupture forces and loading rates. (D) The force-dependent off rate of the anticalin:CTLA-4 complex was plotted against force and fitted using eq 6 (see the Supporting Information) to extract k0, Δx⧧, and ΔG⧧. Error bars represent the standard deviation of off rates measured at four different pulling speeds.

