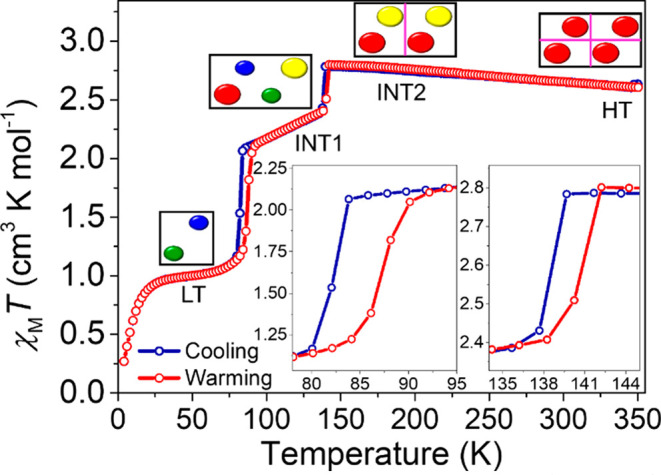
Figure 1.

χMT versus T for complex 1 measured in cooling (blue curve) and warming (red curve) modes between 4 and 350 K with an applied magnetic field, μ0H, of 0.1 T. The insets show the 3 K wide hysteretic transition taken from the midpoints of the transition from 83 to 86 K and the 1 K hysteretic transition from 139 to 140 K. Four crystallographically distinct phases were detected by single-crystal X-ray diffraction (vide infra), and each unit cell is represented by the black box with the unit cell contents depicted with colored ellipses. The large red and yellow ellipses represent Mn3+ sites in the S = 2 HS state, and the small blue and green ellipses represent Mn3+ sites in the S = 1 LS state. Pink lines represent a simplified view of symmetry elements present in the unit cell.
