Figure 5.
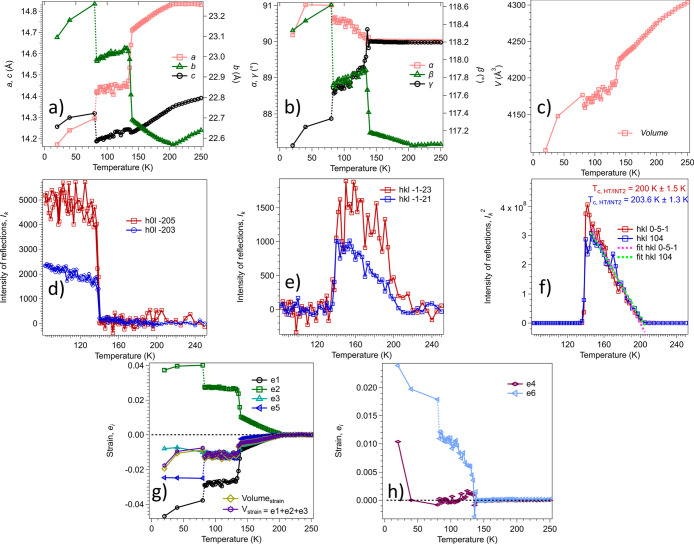
Changes in unit cell parameters (a) a, b, and c, (b) α, β, and γ, and (c) volume, from single-crystal measurements of complex 1 between 250 and 20 K. (d) Intensity of superstructure reflections appearing at the first-order Pc (INT2) → P1 (INT1) transition. The Bragg peaks were indexed in the P1(1/2) space group setting. Intensities of superstructure reflections through the Cc (HT) → Pc (INT2) transition, corresponding to Bragg peaks (hkl) with h + k odd shown for (e) the weaker hkl = −1–23 and −1–21 reflections and (f) the stronger hkl = 0–5–1 and 104 reflections, which appears in diffraction patterns from the Pc phase. The Bragg peaks were indexed in the Cc space group setting. The data show Ik2 ∝ (Tc – T), within experimental uncertainty, and Tc = 202 ± 3 K. (g) Temperature dependence of strain components for the Pc and P1 structures, as defined with respect to the parent Cc structure. All of the strains vary continuously through the Cc (HT) → Pc (INT2) transition at ∼204 K, discontinuously through the Pc (INT2) → P1 (INT1) transition at ∼135 K, and discontinuously through the P1 (INT1) → P1(1/2) (LT) transition at ∼80 K.

