Figure 6.
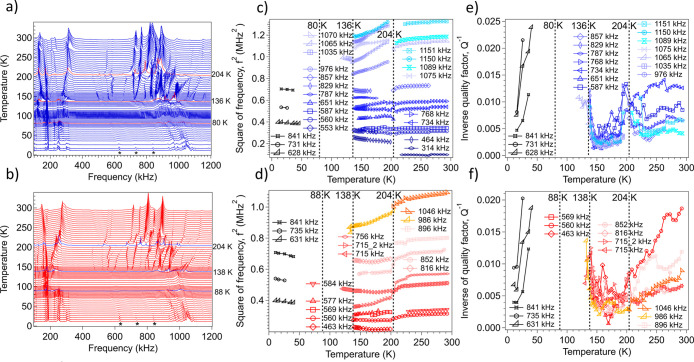
(a, b) RUS spectra as a function of frequency for a single crystal of complex 1, stacked up the y axis in proportion to the temperature at which they were collected. The y axis is amplitude (volts) but has been relabeled as temperature to reveal the overall pattern of stiffening and softening. Spectra were collected during (a) cooling and (b) heating between ∼292 and ∼10 K. Highlighted spectra in both stacks indicate the expected positions of HT → INT2, INT2 → INT1 and INT1 → LT transitions, with thermal hysteresis between the cooling and warming data for the two lower transition points. Stars mark the three peaks that most clearly show the reappearance of resonances with relatively low attenuation at the lowest temperatures. (c, d) f2 and (e, f) Q–1 data from fitting of selected resonances with an asymmetric Lorentzian function. Vertical broken lines mark the continuous structural phase transition at ∼204 K and discontinuous transitions at ∼136/138 and ∼80/88 K. Data shown in black are for the three resonance peaks marked with stars in (a) and (b). Listed in the captions are approximate frequencies for each resonance peak used in the fitting procedure to obtain values of f2 and Q–1.

