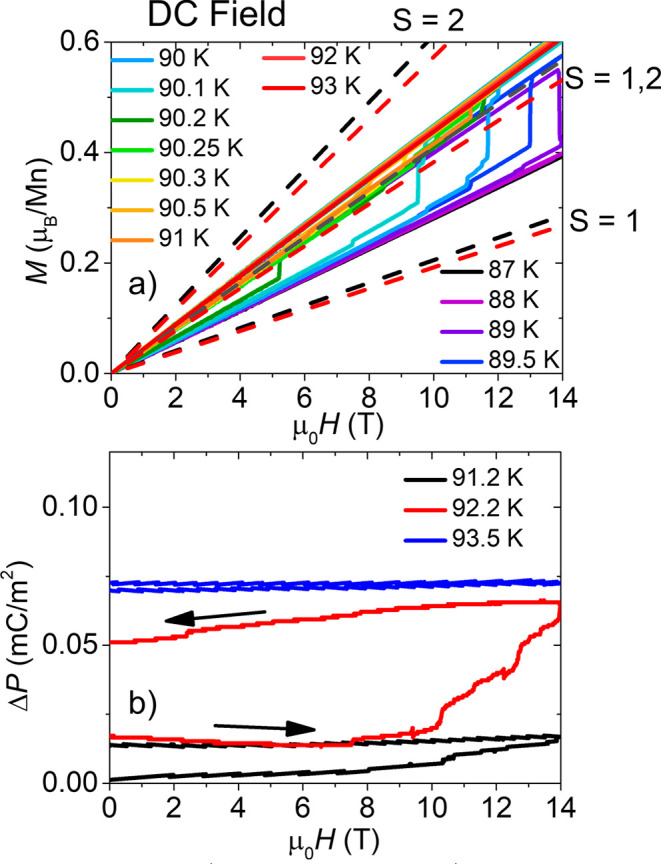
Figure 7.

Change in (a) magnetization, M, and (b) electric polarization, ΔP, vs magnetic field, μ0H. Data were taken in magnetic fields up to 14 T in a superconducting magnet at sweep rates of 100 Oe/s for the different temperatures indicated in the legend. Arrows indicate increasing or decreasing field. Before each scan the temperature was cooled from above 100 K to the final measurement temperature. The dashed lines in (a) are calculated Brillouin functions for S = 1, S = 2, and a mixed 1:1 ratio of S = 1 and S = 2 spin states with no orbital contributions. Upper and lower lines are the lower and upper temperature limits, respectively (87 and 93 K). Data were collected using millimeter-sized single crystals of complex 1 mounted with glue to a sapphire probe with the magnetic field and electric field along the long axis. Two different crystals were measured in (a) and (b), subject to different thermal strain conditions which may have caused the difference in transition temperatures.
