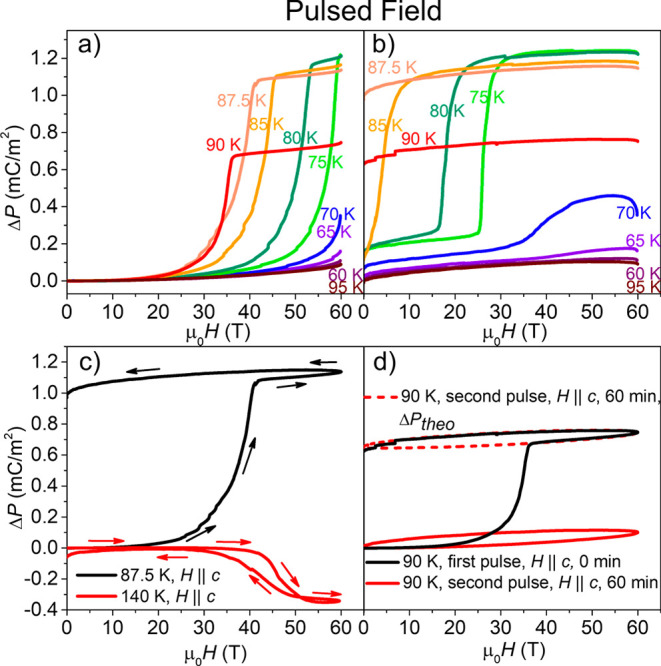
Figure 8.

Change in electric polarization, ΔP, induced by a 60 T pulsed magnetic field, μ0H, applied to a single crystal of complex 1 for different temperatures as indicated. ΔP versus μ0H measured during (a) rising fields and (b) falling fields for temperatures between 60 and 90 K. Random errors are smaller than the line width. Systematic errors due to mechanical vibrations caused the oscillations observed in the pulsed field magnetization data. The maximum change in electric polarization induced by the 60 T pulsed magnetic field, 1.23 mC m–2, was observed at 75 K. (c) Change in sign of ΔP measured inside the two regions of bistability, the P1 → Pc (red plot) and P1(1/2) → P1 (black plot) transitions. The changes in ΔP observed in the regions of bistability for the P1 → P1(1/2) and Pc → P1 transitions were 1.14 and −0.35 mC m–2, respectively. (d) ΔP versus μ0H applied at 90 K, followed by a waiting period at 90 K for 45 min before applying a second pulse. ΔP reached a maximum of ∼ 0.75 mC m–2 during the first pulse. In the second pulse the signal showed no transition (red full line). We thus conclude that the sample remained in the HS state between pulses, and hence that the data represented by the red line should contain an additional offset (this magnetometer measures only the change in magnetization with field, not the absolute magnetization). To illustrate this, the dashed red line shows the red data with the addition of a presumed offset.
