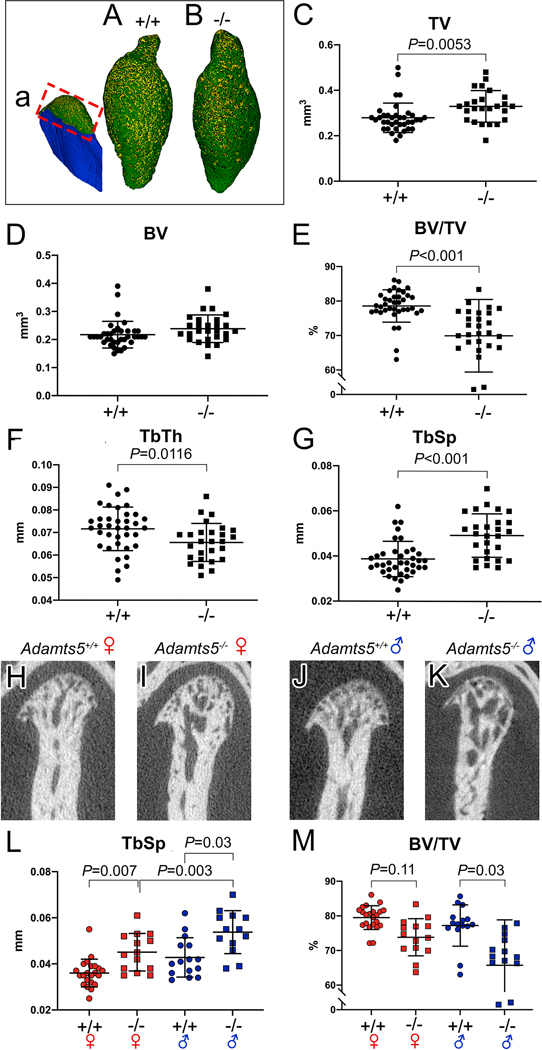
Figure 2: Young adult female and male Adamts5−/− mice exhibit changes in the subchondral bone of the mandibular condyle.
Three dimensional reconstructions of microtomography (μCT) of mandibular condyles in wild type (a, A) and Adamts5−/− mice (B). Red box in ‘a’ refers to the region of μCT analysis in C-M. Each point on the graph represents measurements from one condyle. TV-trabecular volume; BV-bone volume; BV/TV-bone volume/trabecular volume = bone density; Tb. Th-trabecular thickness; Tb. Sp. –trabecular spacing. H-K are two dimensional μCT slices of female Adamts5+/+ (H), male Adamts5+/+ (I), female Adamts5−/− (J) and male Adamts5−/− (K). μCT data was analyzed by sorting the sexes of mice (L, M), there was a significant difference between male and female Adamts5−/− mice in the trabecular spacing of the mandibular condyle, and the bone density (BV/TV) was more significantly reduced in male mice compared to female mice. The longer bars on the graphs represent the average of the mean, with the shorter bars denoting standard deviation. Bar in C, P=0.0053; E, P<0.001; F, P=0.0116; G, P<0.001; L (left to right), P=0.007,P=0.003, P=0.03; M (left to right), P=0.11, 0.03.

