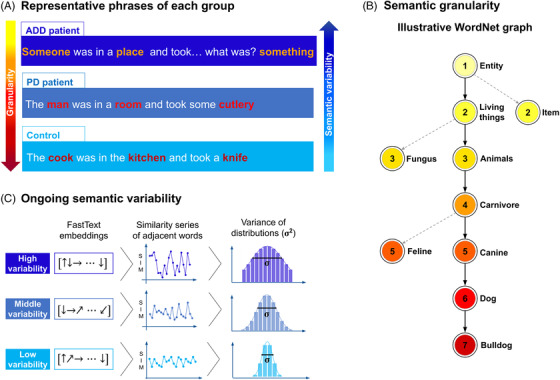
FIGURE 1.

Illustration of target measures. (A) Representative phrases of ADD patients, PD patients, and healthy controls, showing the predicted gradient of semantic granularity (red scale) and ongoing semantic variability (blue scale). (B) Segment of the WordNet network showing hierarchical relations from the least granular node ("entity") to progressively more granular nodes (down to "bulldog"). Granularity values are marked by color and number. Nodes serving as starting points of dotted lines show network bifurcations that do not lead to the "bulldog" node. Multiple relevant and intermediate nodes are omitted for brevity. (C) Schemes for the computation of ongoing semantic variability. The diagrams show FastText embeddings, adjacent‐word‐pair similarity series, and distributions for texts presenting high variability (top row), middle variability (middle row), and low variability (bottom row). Abbreviations: ADD, Alzheimer's disease dementia; PD, Parkinson's disease
