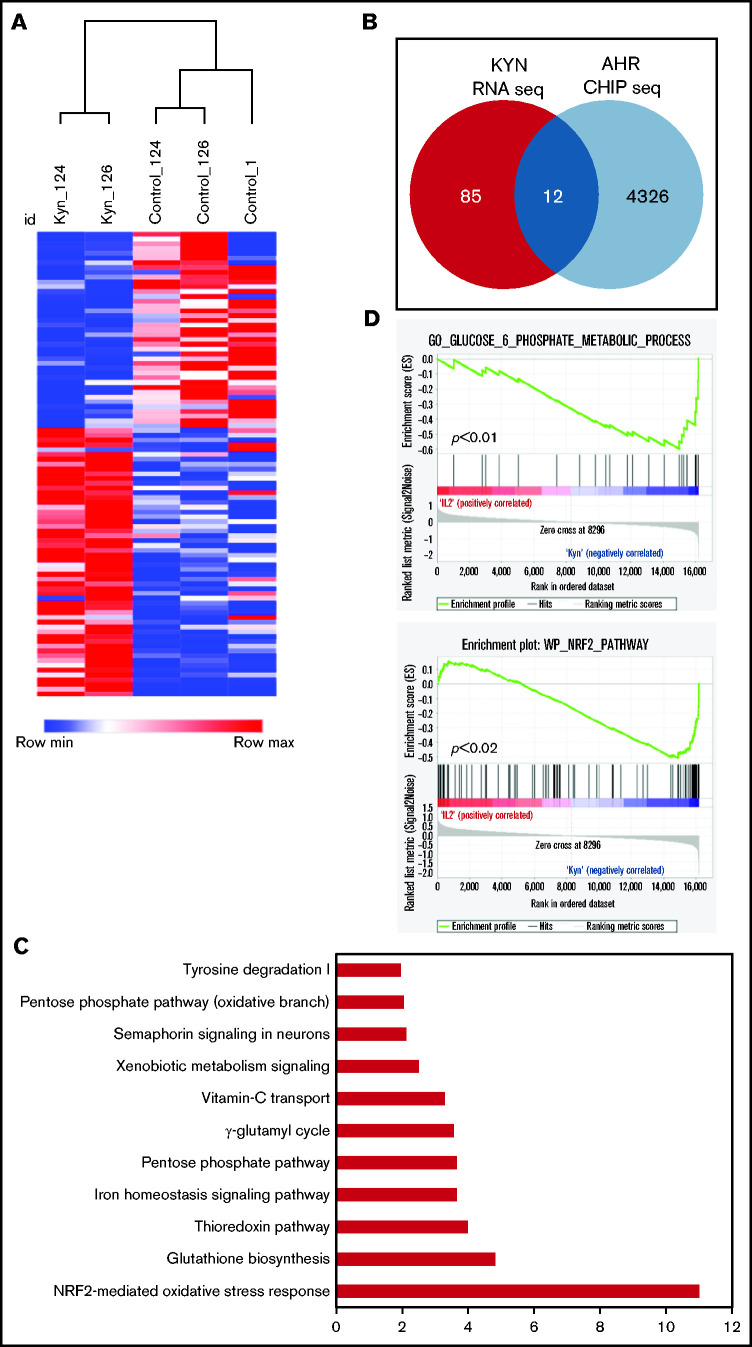
Figure 6.
AHR agonists suppress NK-cell function. (A) Heatmap showing hierarchical clustering of DEGs between Kyn and DMSO (control) in day 14 expanded NK cells. Donor-matched control or Kyn expanded NK cells were used for RNA-seq. The results show expression of genes that change 1.5-fold (P < .05). (B) Venn diagram showing the number of the DEGs genes and AHR targets genes in NK cells expanded with Kyn. (C) IPA analysis showing the top 10 pathways. Gene ontology was performed using the list of differentially expressed AHR target genes from day 14 NK cells expanded with Kyn. (D) Gene Set Enrichment Analysis (GSEA) analysis showing an enrichment of glucose metabolic (top) and NRF2 (bottom) pathways in NK cells expanded with Kyn.

