Figure 7.
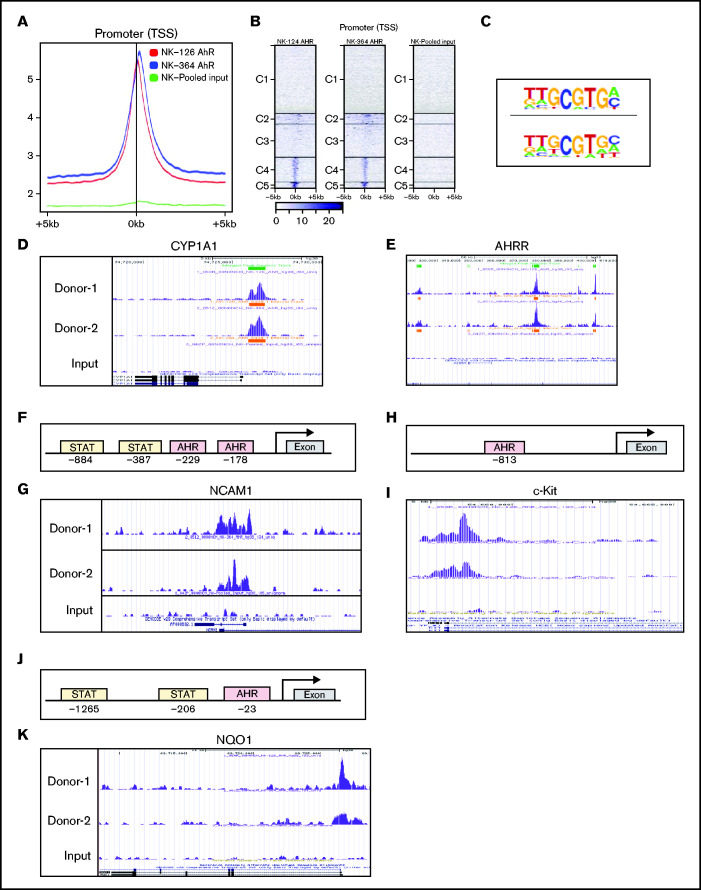
AHR regulates NCAM1 and NQO1 expression. (A) Distributions of peaks across the TSS of gene promoters. ChIP-seq was performed using anti-AHR antibody on FC21-expanded NK cells from 2 donors on day 14. The reads were aligned to the human genome (hg38). (B) Heatmap showing the distribution of peaks across the gene promoter within 5 kb of TSS. The peaks are clustered into 5 regions indicated as C1 to C5. (C) De novo motifs were identified using the Human Organ-specific Molecular Electronic Repository (HOMER) package using default parameters and input sequences comprising ±100 bp from the center of the top 1000 peaks. The highest-ranking motif from each sample is shown. (D-E) ChIP-seq data showing recruitment of AHR to the proximal regions of gene promoters in day 14 FC21-expanded NK cells. Peaks were visualized using the University of California, Santa Cruz (UCSC) genome browser. (D) Cytochrome P450 A1 and (E) AHR repressor. (F) Schematic showing the position of Stat3 and AHR binding sites on the human NCAM1 (CD56) promoter relative to the transcriptional start site and first exon. (G) ChIP-seq data showing the recruitment of AHR to NCAM1 promoter in day 14 FC21-expanded NK cells. (H) Schematic showing the position of AHR binding sites on the human KIT (CD117) promoter relative to the transcriptional start site and first exon. (I) ChIP-seq data showing the recruitment of AHR to the promoter of KIT in day 14 FC21 expanded NK cells. (J) Schematic showing the position of Stat3 and AHR sites on the gene NADPH quinone oxidoreductase (NQO1) relative to TSS. (K) Recruitment of AHR to the NQO1 gene promoter in D14-expanded NK cells.

