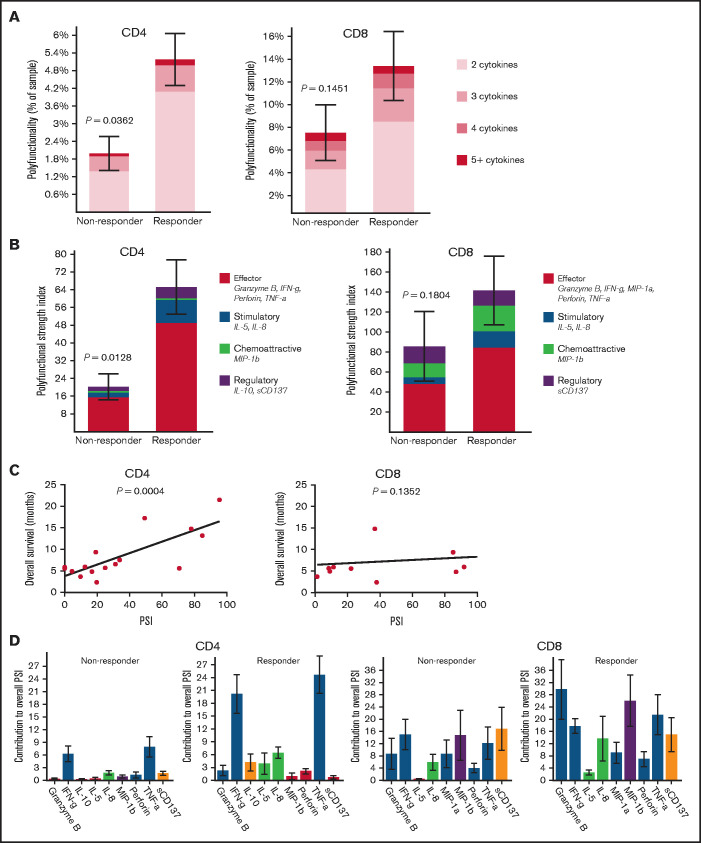
Figure 1.
Pretreatment polyfunctional bone marrow CD4+ T cells demonstrate the significant positive correlations with AML patient response to the anti–PD-1–based therapy and overall survival. Polyfunctionality, defined as single-cells co-secreting at least 2 or more proteins, reveals the varying degrees of polyfunctional single cells from the samples, with the darker the orange, the higher the number of unique cytokine combinations secreted per single-cell. PSI aggregates all single cell multidimensional data into a single index, defined as the percentage of polyfunctional cells, multiplied by the sum of the mean fluorescence intensity of the proteins secreted by those cells.7–10,19,21,22 The displayed index is color-coded to show the contribution from different categories of cytokines (eg, effector, stimulatory, chemoattractive, regulatory cytokines). (A) Polyfunctional CD4+ subset can significantly distinguish responding patients to the therapy from nonresponding patients compared with CD8+ subset. (B) PSI of CD4+ subset can significantly segregate responding patients to the therapy from nonresponding patients compared with CD8+ subset, with greater increases of antitumor-associated protein secretions in both CD4+ and CD8+ subsets from responders relative to nonresponders. (C) PSI of CD4+ subset shows a significant positive association with OS (overall survival in months) compared with CD8+ PSI, suggesting the impact of polyfunctional bone marrow CD4+ T-cell subsets on predicting AML patient responses to anti–PD-1 therapy. (D) The PSI composition further uncovers IFN-γ and TNF-α are the major drivers for enhanced PSI of CD4+ subset dissecting the response differences to the therapy between responding and nonresponding patients, whereas Granzyme B, IFN-γ, MIP-1b, and TNF-α seem to mainly drive enhanced PSI of CD8+ subset in the responders. PSI profiles were broken down per cytokine, between response groups, to reveal the specific proteins driving the PSI. The statistical P values were computed using Mann-Whitney U test or Pearson's correlations.

