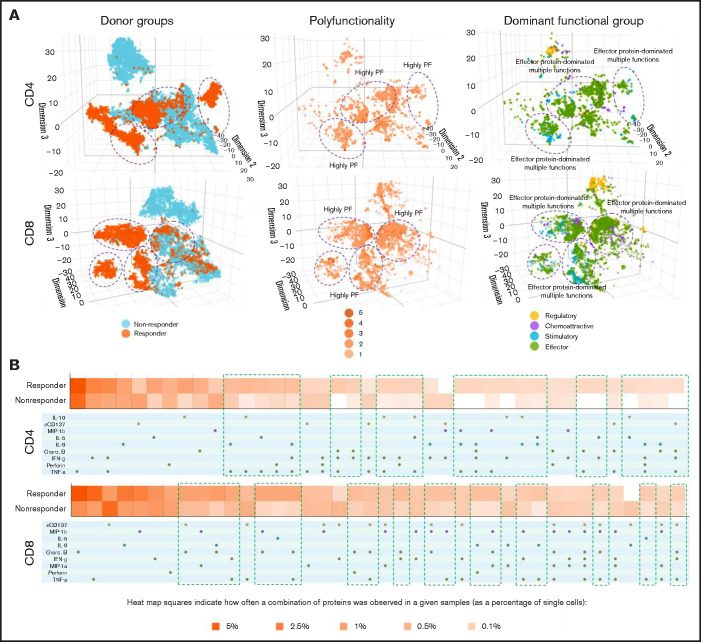
Figure 2.
Three-dimensional t-distributed stochastic neighbor embedding (t-SNE) and heatmap visualizations reveal distinct cell clusters with cytokine signatures in pretreatment bone marrow CD4+ and CD8+ cell subsets between nonresponding and responding patients to the anti–PD-1–based therapy. (A) Three-dimensional t-SNE functional graphs plot single cells by differentiating them based on their greatest cytokine-based functional differences. The responders show more prominent increases of polyfunctional cell subsets with antitumor-associated protein secretions in CD4+ and CD8+ subsets than nonresponders (highlighted in purple circles). Donor group cell mapping stratifies data points from samples by responders (orange) and nonresponders (blue). Polyfunctionality cell mapping visualizes the data points based on the degree of polyfunctionality from the sample, with the darker the orange, the higher number of unique cytokines secreted per single cell. Dominant functional group mapping displays a color-coded visualization of data points based on the dominant cytokine profile being secreted, revealing biological drivers. (B) Functional heatmap compares the frequency at which various monofunctional and polyfunctional groups are secreted by the samples. The heatmap reveals the greater upregulation of polyfunctional subpopulations with unique cytokine signatures in both CD4+ and CD8+ subsets from responding patients compared with nonresponders (highlighted in green rectangles).

