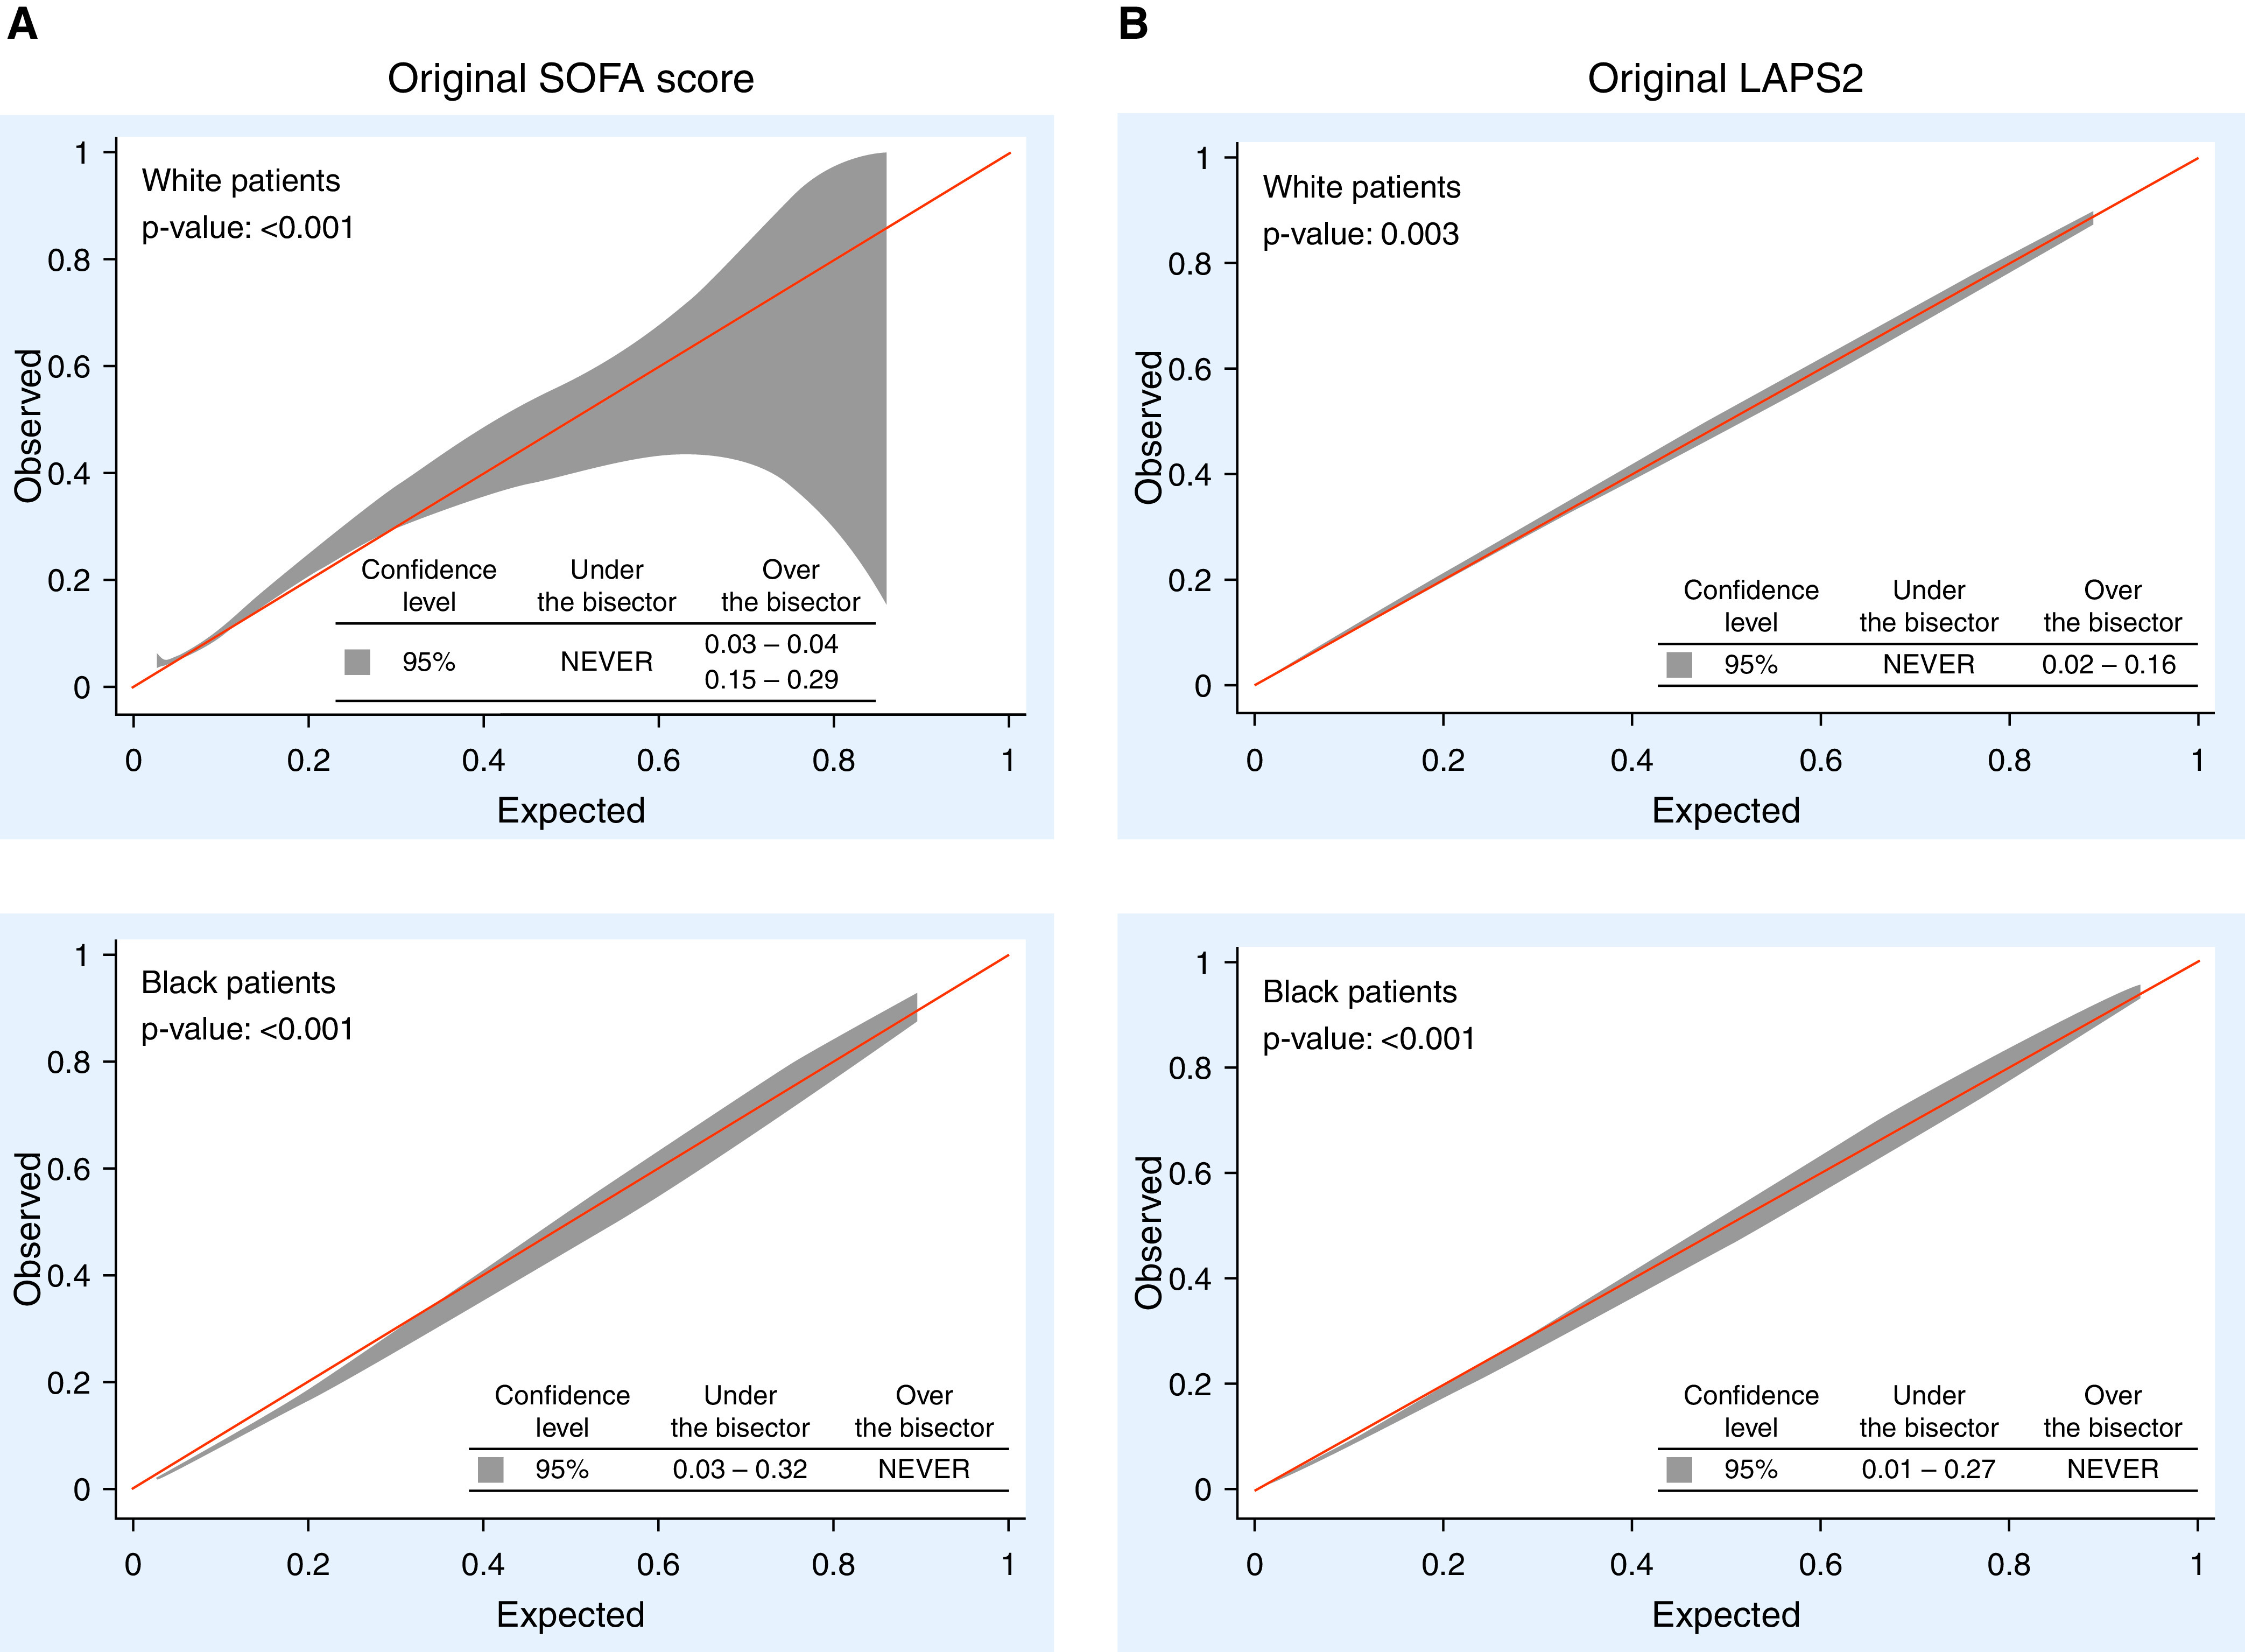
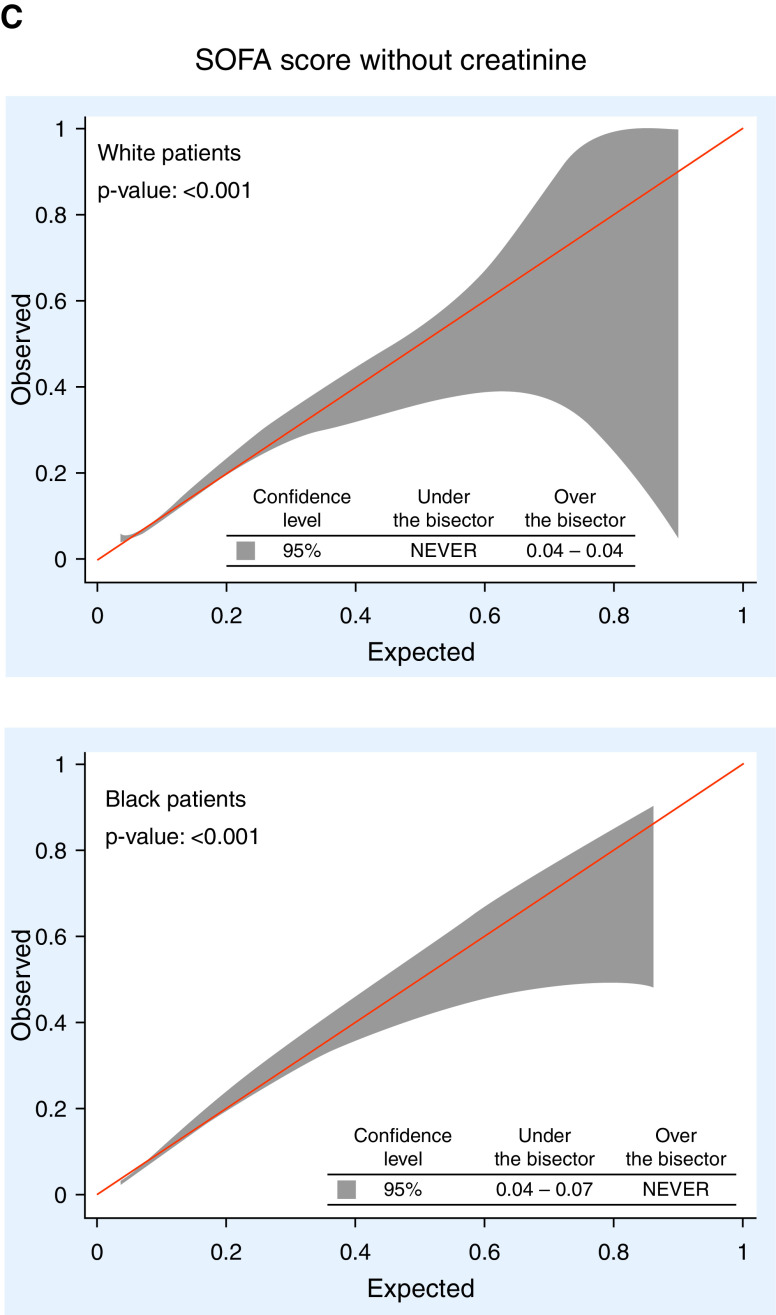
Figure 2.

Calibration belts for selected mortality prediction scores among white and Black patients. (A) Original Sequential Organ Failure Assessment (SOFA) score. (B) Original LAPS2. (C) SOFA score without creatinine. A P value < 0.05 indicates miscalibration. Reported at the bottom of each graph are values of expected mortality for which observed values are significantly under (i.e., the model overestimates mortality) or over (i.e., the model underestimates mortality) the bisector using the 95% confidence interval (shaded area of the graph). LAPS2 = version 2 of the Laboratory-based Acute Physiology Score.

