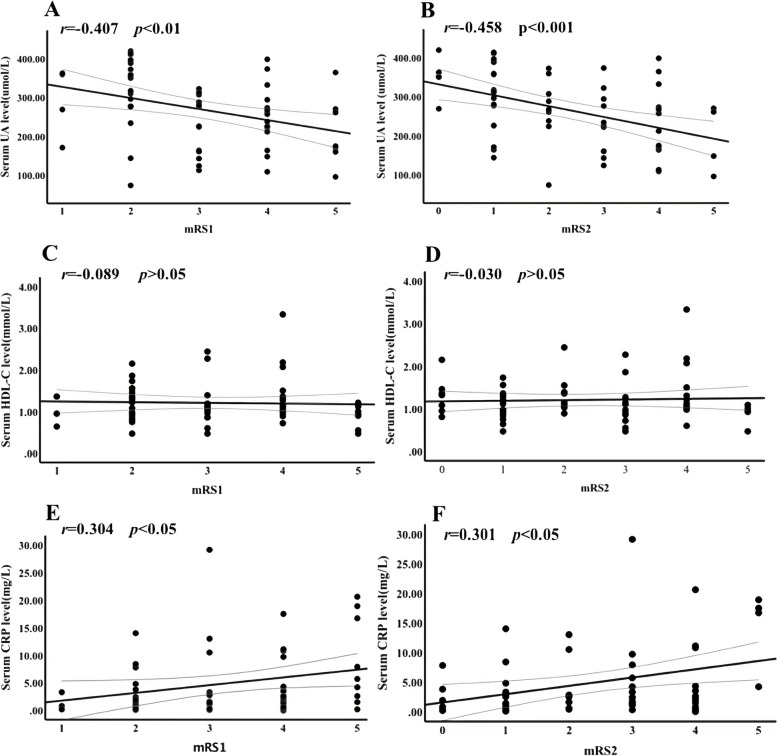
Fig. 4.
Correlation between serologic markers before treatment and mRS scores of anti-NMDAR encephalitis patients. p < 0.05 was considered significant. A negative correlation between UA and mRS scores before treatment (mRS1)(r = − 0.407, p < 0.01); B negative correlation between UA and mRS scores after treatment (mRS2) (r = − 0.458, p < 0.001); C correlation between HDL-C and mRS1(r = − 0.089, p > 0.05); D correlation between HDL-C and mRS2(r = − 0.030, p > 0.05); E positive correlation between CRP and mRS1(r = 0.304, p < 0.05); F positive correlation between CRP and mRS2(r = 0.301, p < 0.05). mRS, modified Rankin scale; mRS1, mRS scores before treatment; mRS2, mRS scores after treatment; anti-NMDAR, anti-N-methyl-D-aspartate receptor; UA, uric acid; HDL-C, high density lipoprotein cholesterol; CRP, C-reactive protein

