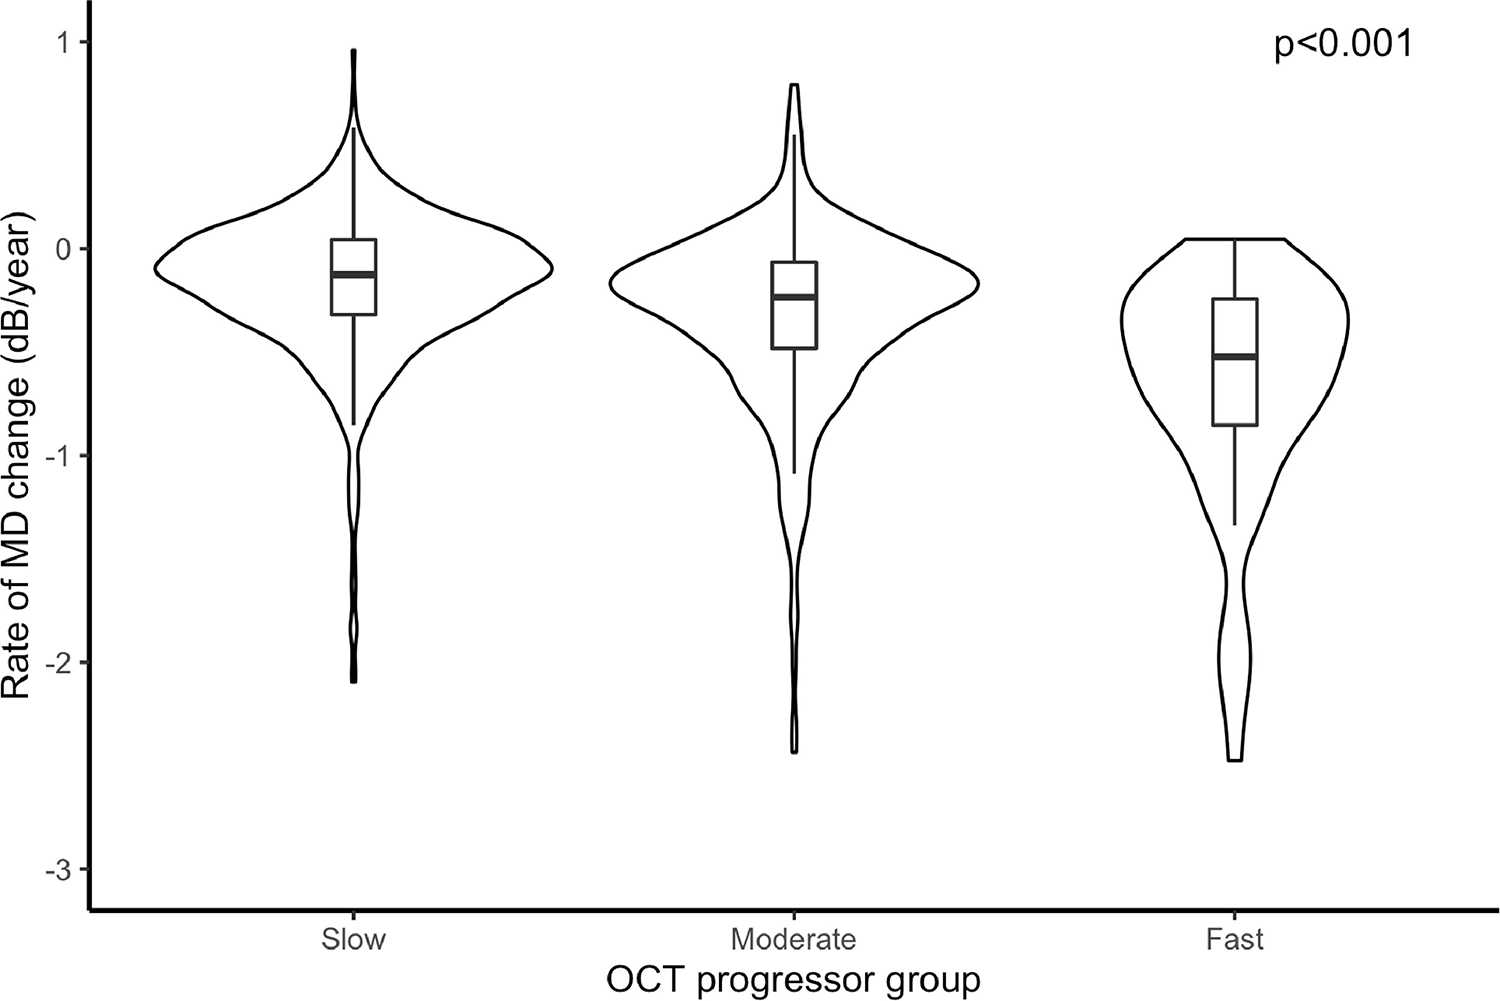
Figure 1.

Rates of change in mean deviation (MD) among all slow, moderate, and fast progressors, as defined by the rates of retinal nerve fiber layer thickness loss in the first 5 optical coherence tomography (OCT) tests. * Linear mixed model. Rates of global OCT retinal nerve fiber layer thickness loss: slow (slower than −1.0 μm/year); moderate (between −1.0 and −2.0 μm/year); fast (faster than −2.0 μm/year).
