
Figure 2.
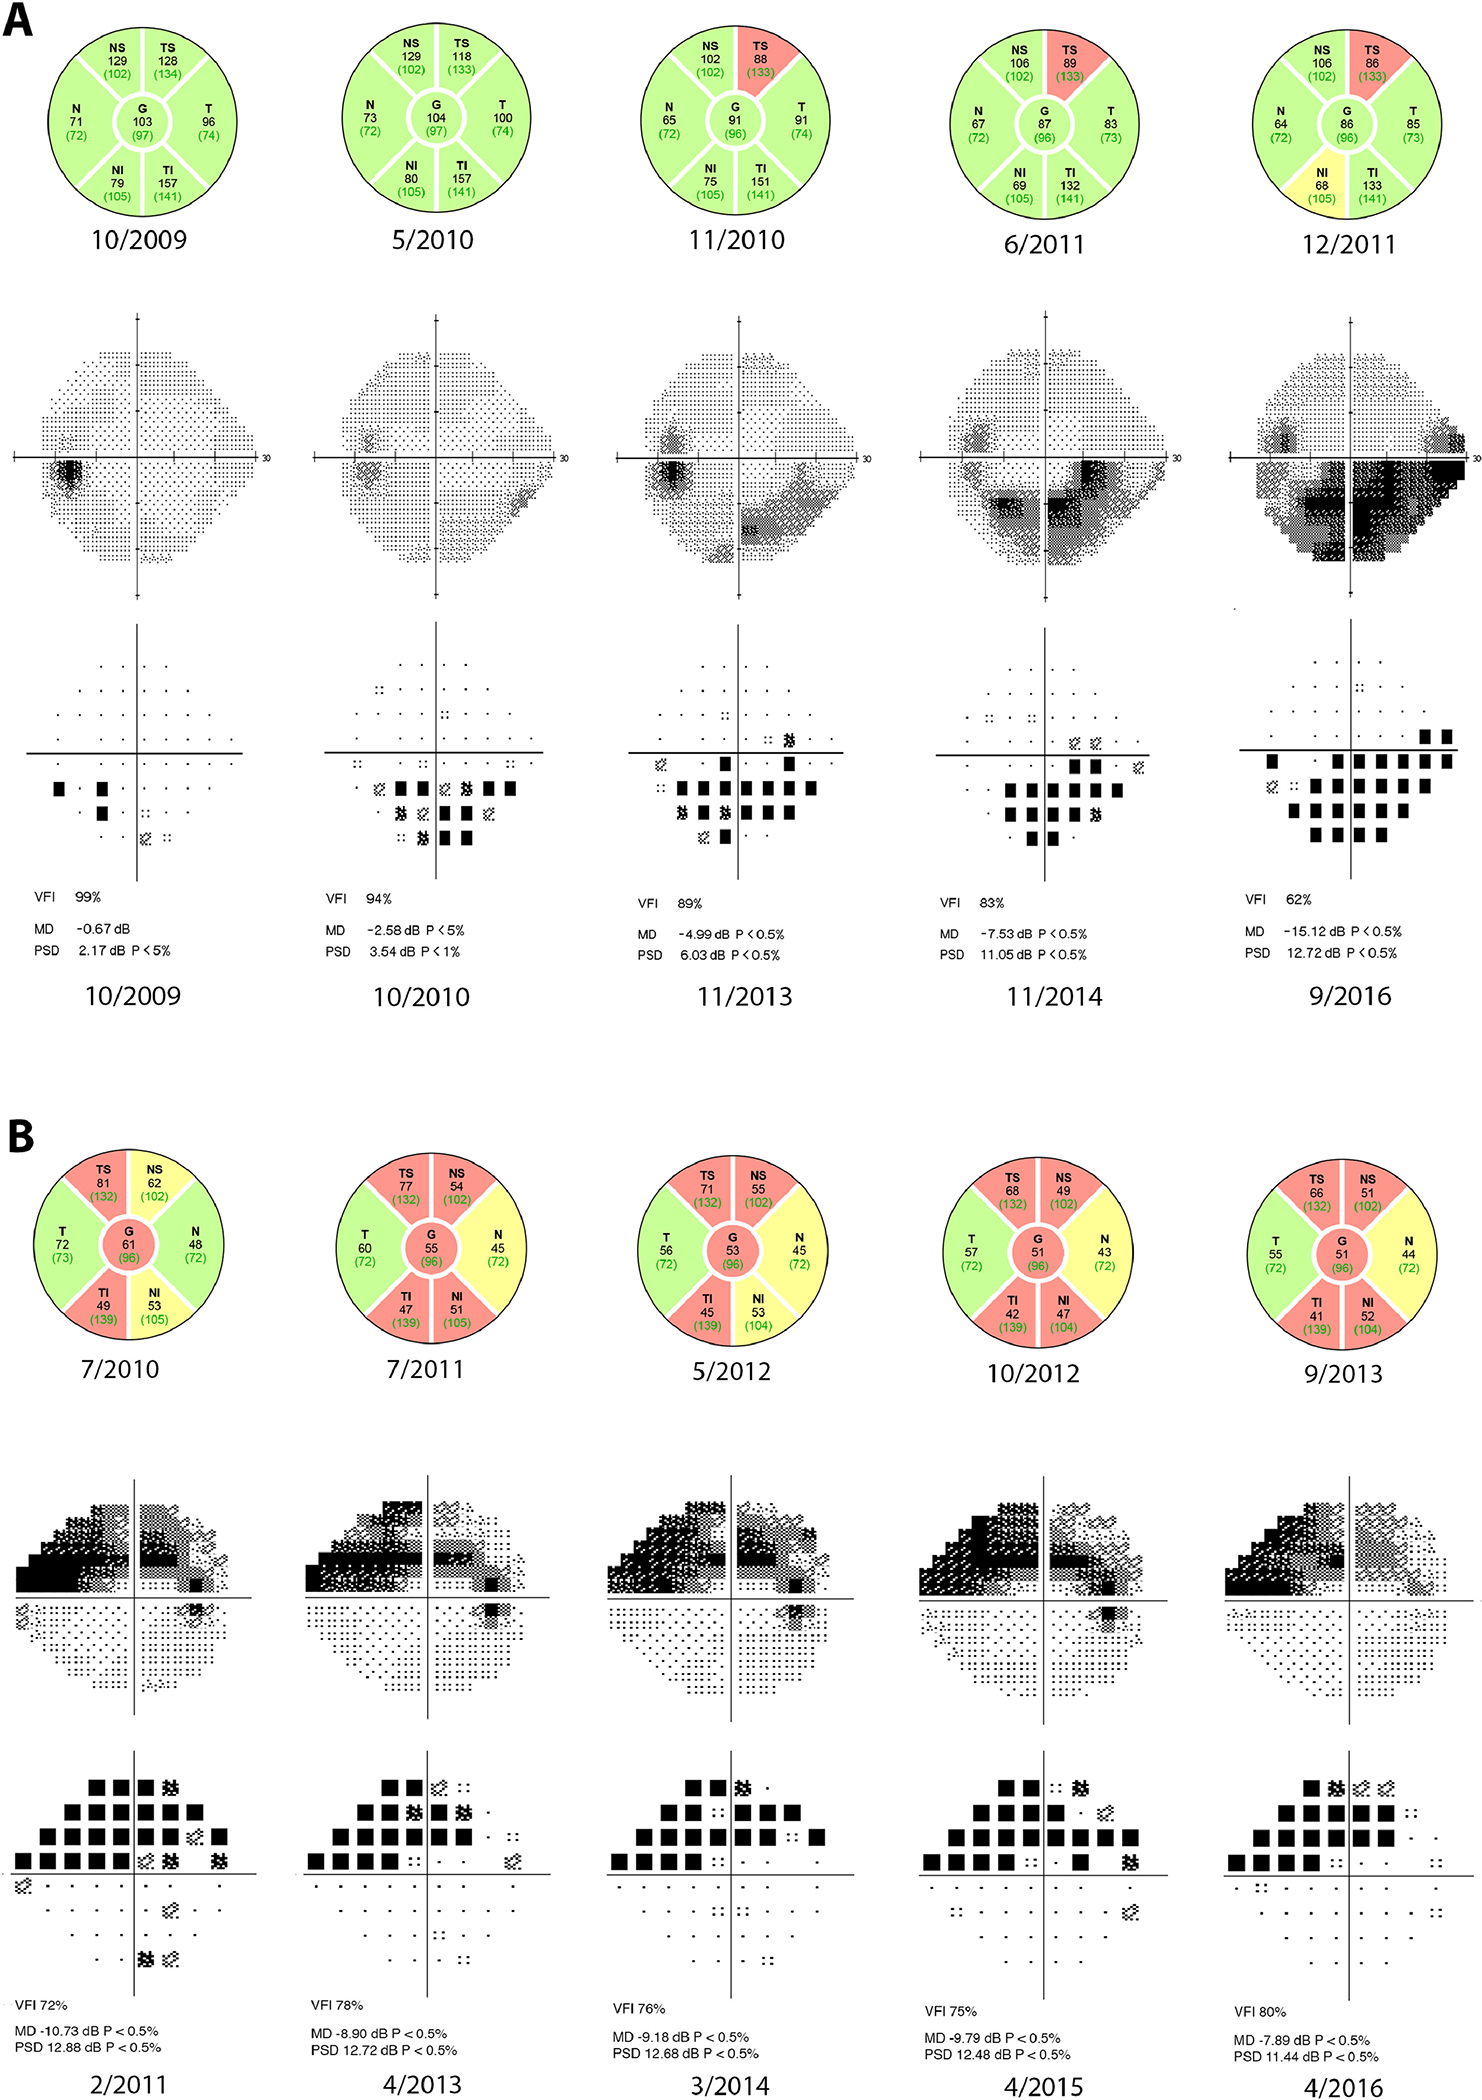
Case examples of strong and weak correlation between initial changes on optical coherence tomography (OCT) and concurrent or subsequent changes in standard automated perimetry (SAP). The five OCTs used in the study are displayed, while representative visual fields from the total follow-up period are presented. Respective dates are listed. (A) Testing from a 48-year old African-American male. The estimated retinal nerve fiber layer (RNFL) OCT rate of loss was −4.02 μm/year and estimated SAP mean deviation (MD) rate of loss was −1.19 dB/year. Initial follow-up period for OCT was 2.1 years, while total follow-up period for SAP was 8.5 years. (B) Testing from a 56-year old Caucasian female. The estimated RNFL OCT rate of loss was −1.71 μm/year, but estimated SAP MD rate of loss was only −0.02 dB/year. Initial follow-up period for OCT was 3.1 years, while total follow-up period for SAP was 5.1 years.