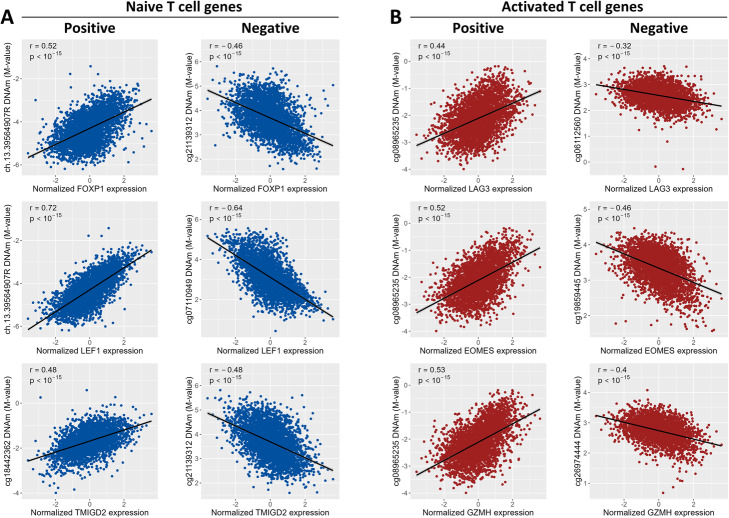
Fig. 3.
Examples of positive and negative correlations between clock CpG DNAm and gene expression (rank-inverse normal transformed), as identified in the linear regression analysis. The subfigures show the Pearson correlation (r) between gene expression and DNA methylation for a gene-CpG pair, as well as the p value for the correlation. A Positive and negative correlations identified for three genes with known expression in naive T-cells: FOXP1, LEF1, and TMIGD2. B Positive and negative correlations identified for three genes with known expression in activated T cells: LAG3, EOMES, and GZMH

