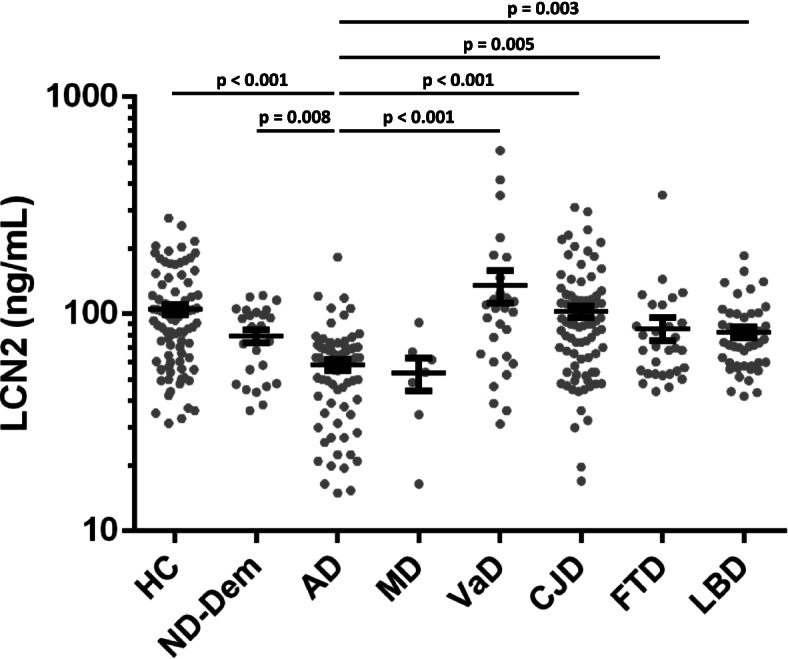
Fig. 1.

Plasma LCN2 in the differential diagnosis of dementia. Plasma LCN2 concentrations in diagnostic groups. Comparison of biomarker concentrations of diagnostic groups was performed with linear regression models; age and sex were included as covariates. Multiple comparisons were performed with Tukey contrasts. P-values are indicated above dot columns. Bars indicate mean and standard error of mean. MD group is presented for visualization purposes but excluded from data analyses due to the low number of cases. HC, healthy controls; ND-Dem, non-neurodegenerative neurological diseases with dementia syndrome; AD, Alzheimer’s disease; CJD, Creutzfeldt-Jakob disease; LBD, Lewy body diseases (dementia with Lewy bodies and Parkinson’s disease dementia); FTD, fronto-temporal dementia; and VaD, vascular dementia
