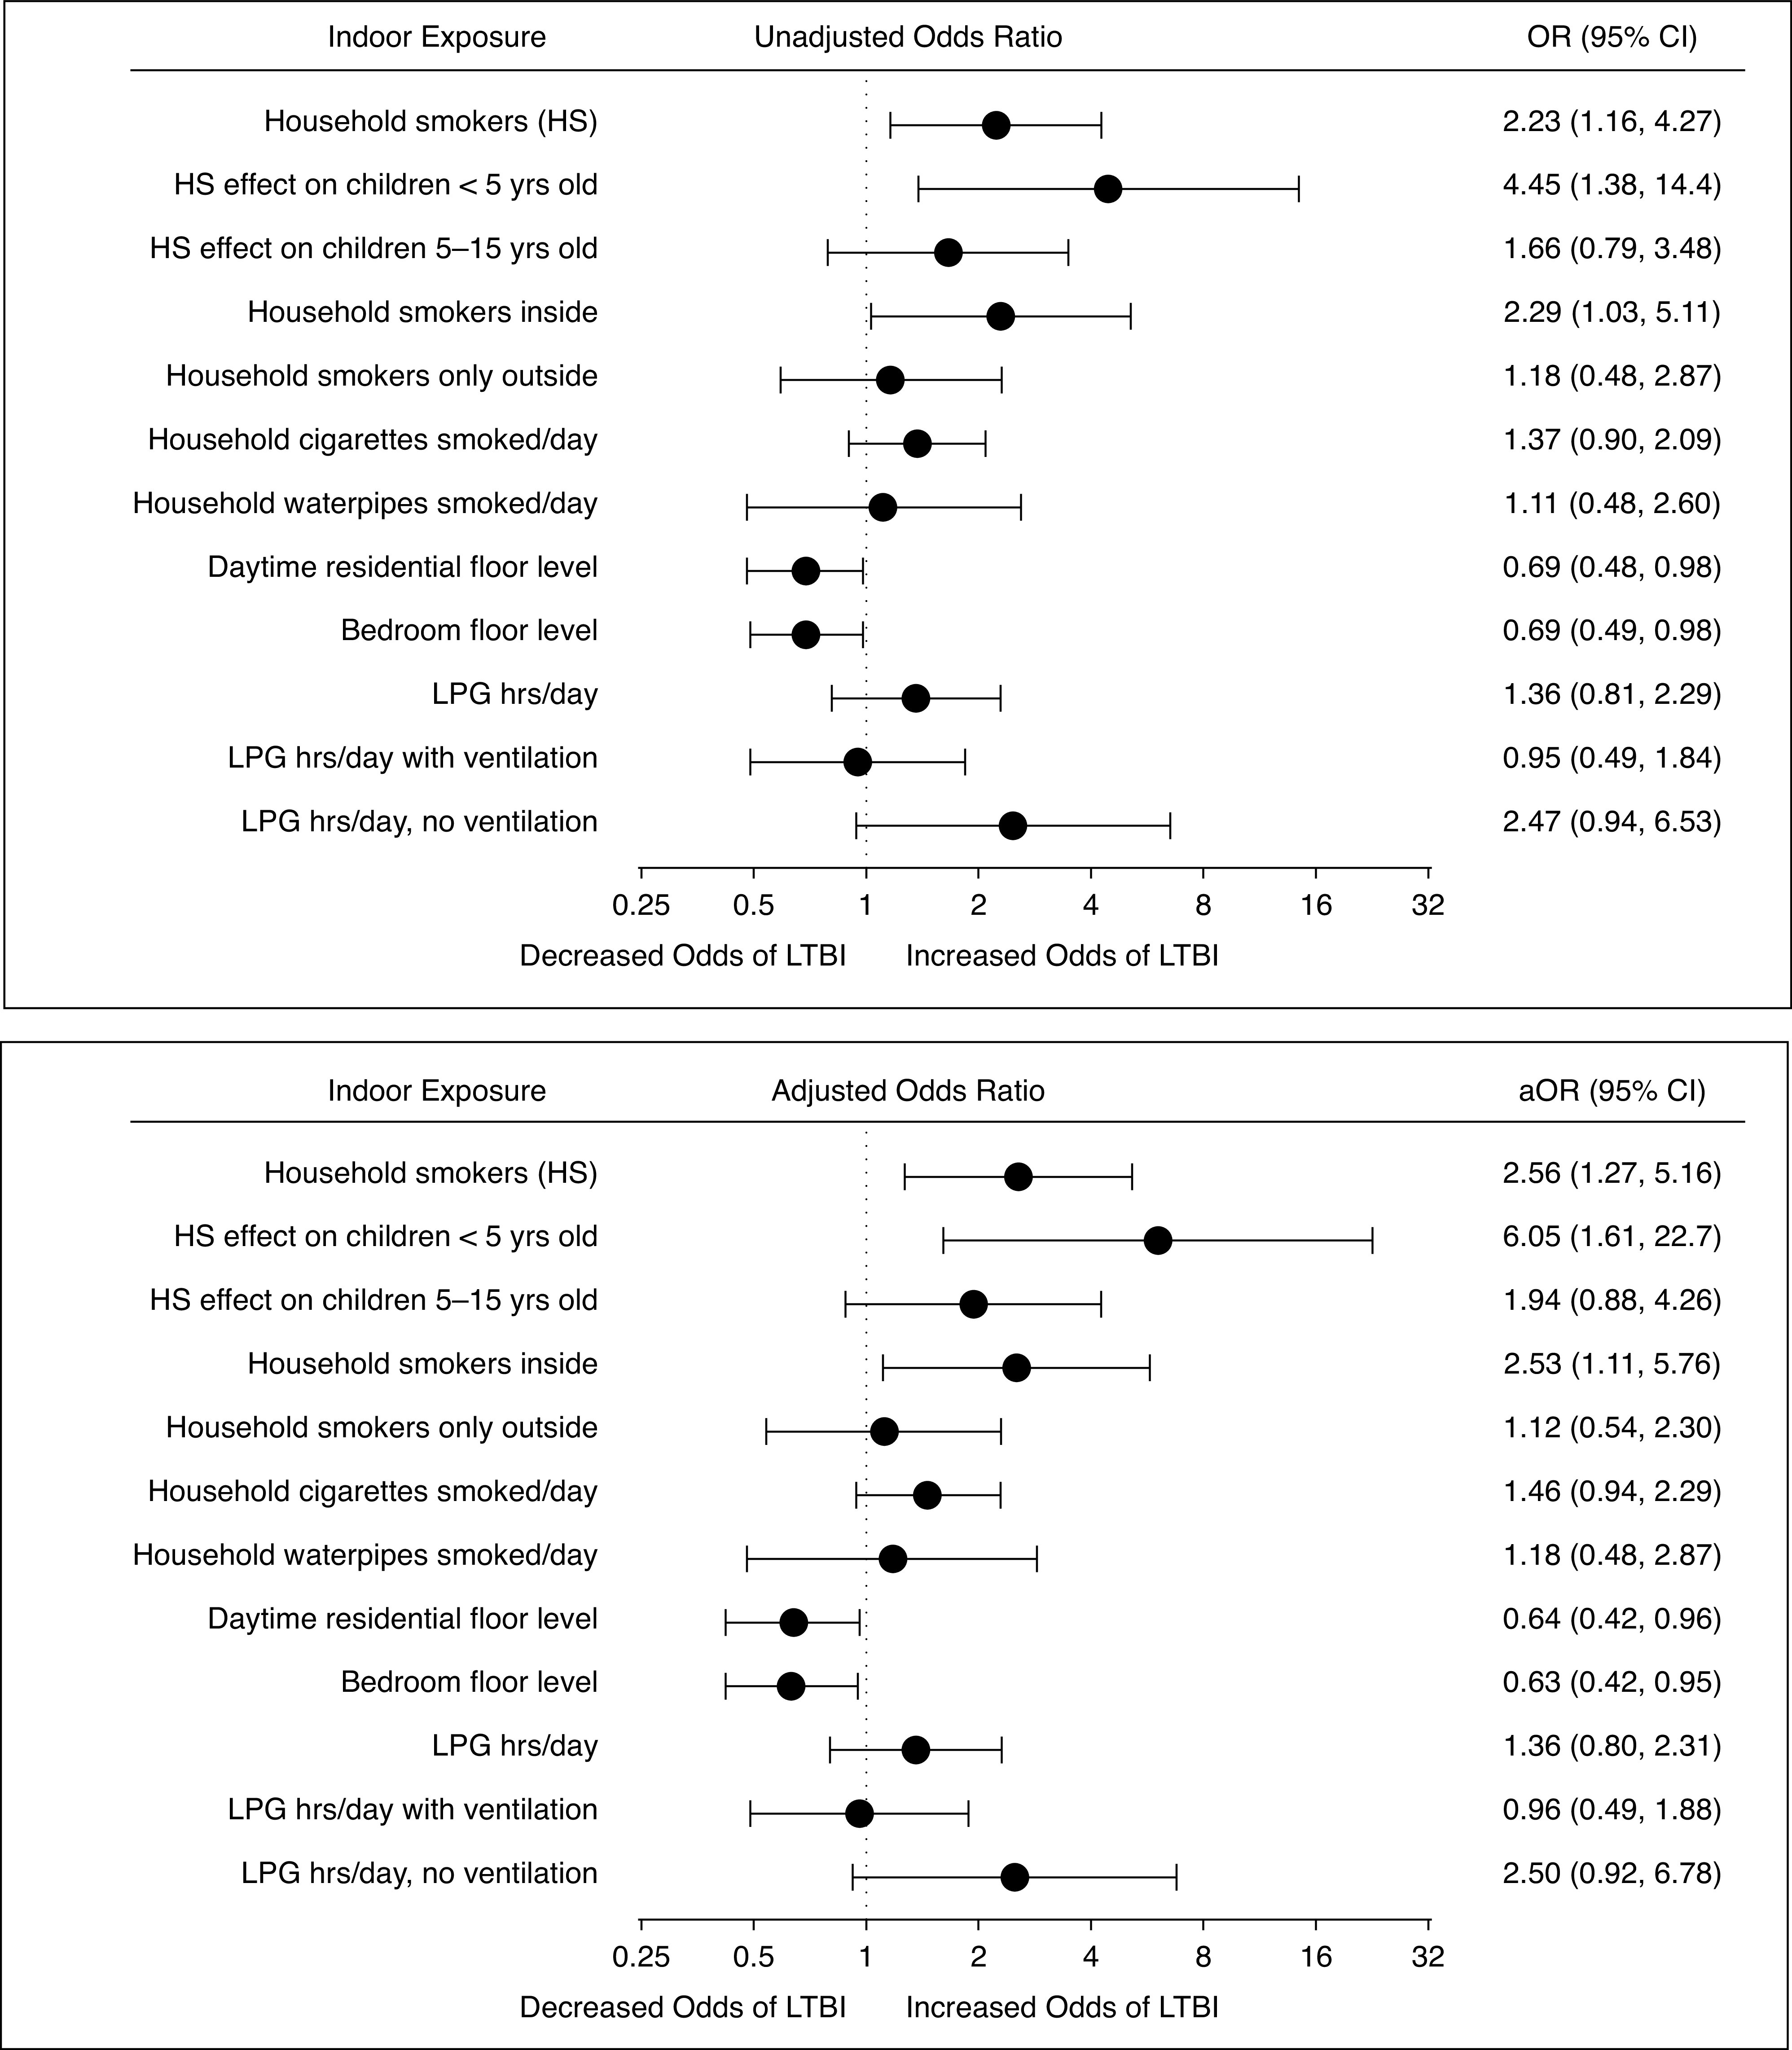
Figure 2.

Unadjusted odds (top) and adjusted odds (bottom) of LTBI by air pollution continuous exposure variables (n = 109). We fit a separate generalized estimating equation model for each indoor exposure, with LTBI as the outcome and each model adjusted for age, sex, body mass index z-score, and household employment. Two interactions were also tested with this model: 1) the interaction between HS and age of household contacts, P-interaction 0.12; and 2) the interaction between LPG cooking hours per day and active kitchen ventilation (hood above the cooking stove or fan in the kitchen window), P-interaction also 0.12. Units were expressed in number of HS; number of cigarettes or waterpipes smoked per day (in increments of 10); floor level lived and slept on; and hours of LPG use per day. Zero was the referent value for all variables except floor level, where ground (first floor) was the referent. The aOR represented the adjusted odds of LTBI for each unit increase of continuous exposure variable. For instance, for each additional household member who was a smoker, there was a 2.56-fold higher odds of LTBI in the household contact; and for each higher floor the household contact’s bedroom was located on, there was a 37% lower odds of LTBI. Continuous models should not be interpreted outside the range of observed exposure values (see Table 2 for observed exposure value ranges). aOR = adjusted odds ratio; CI = confidence interval; HS = household smokers; LPG = liquid petroleum gas; LTBI = latent tuberculosis infection; OR = odds ratio.
