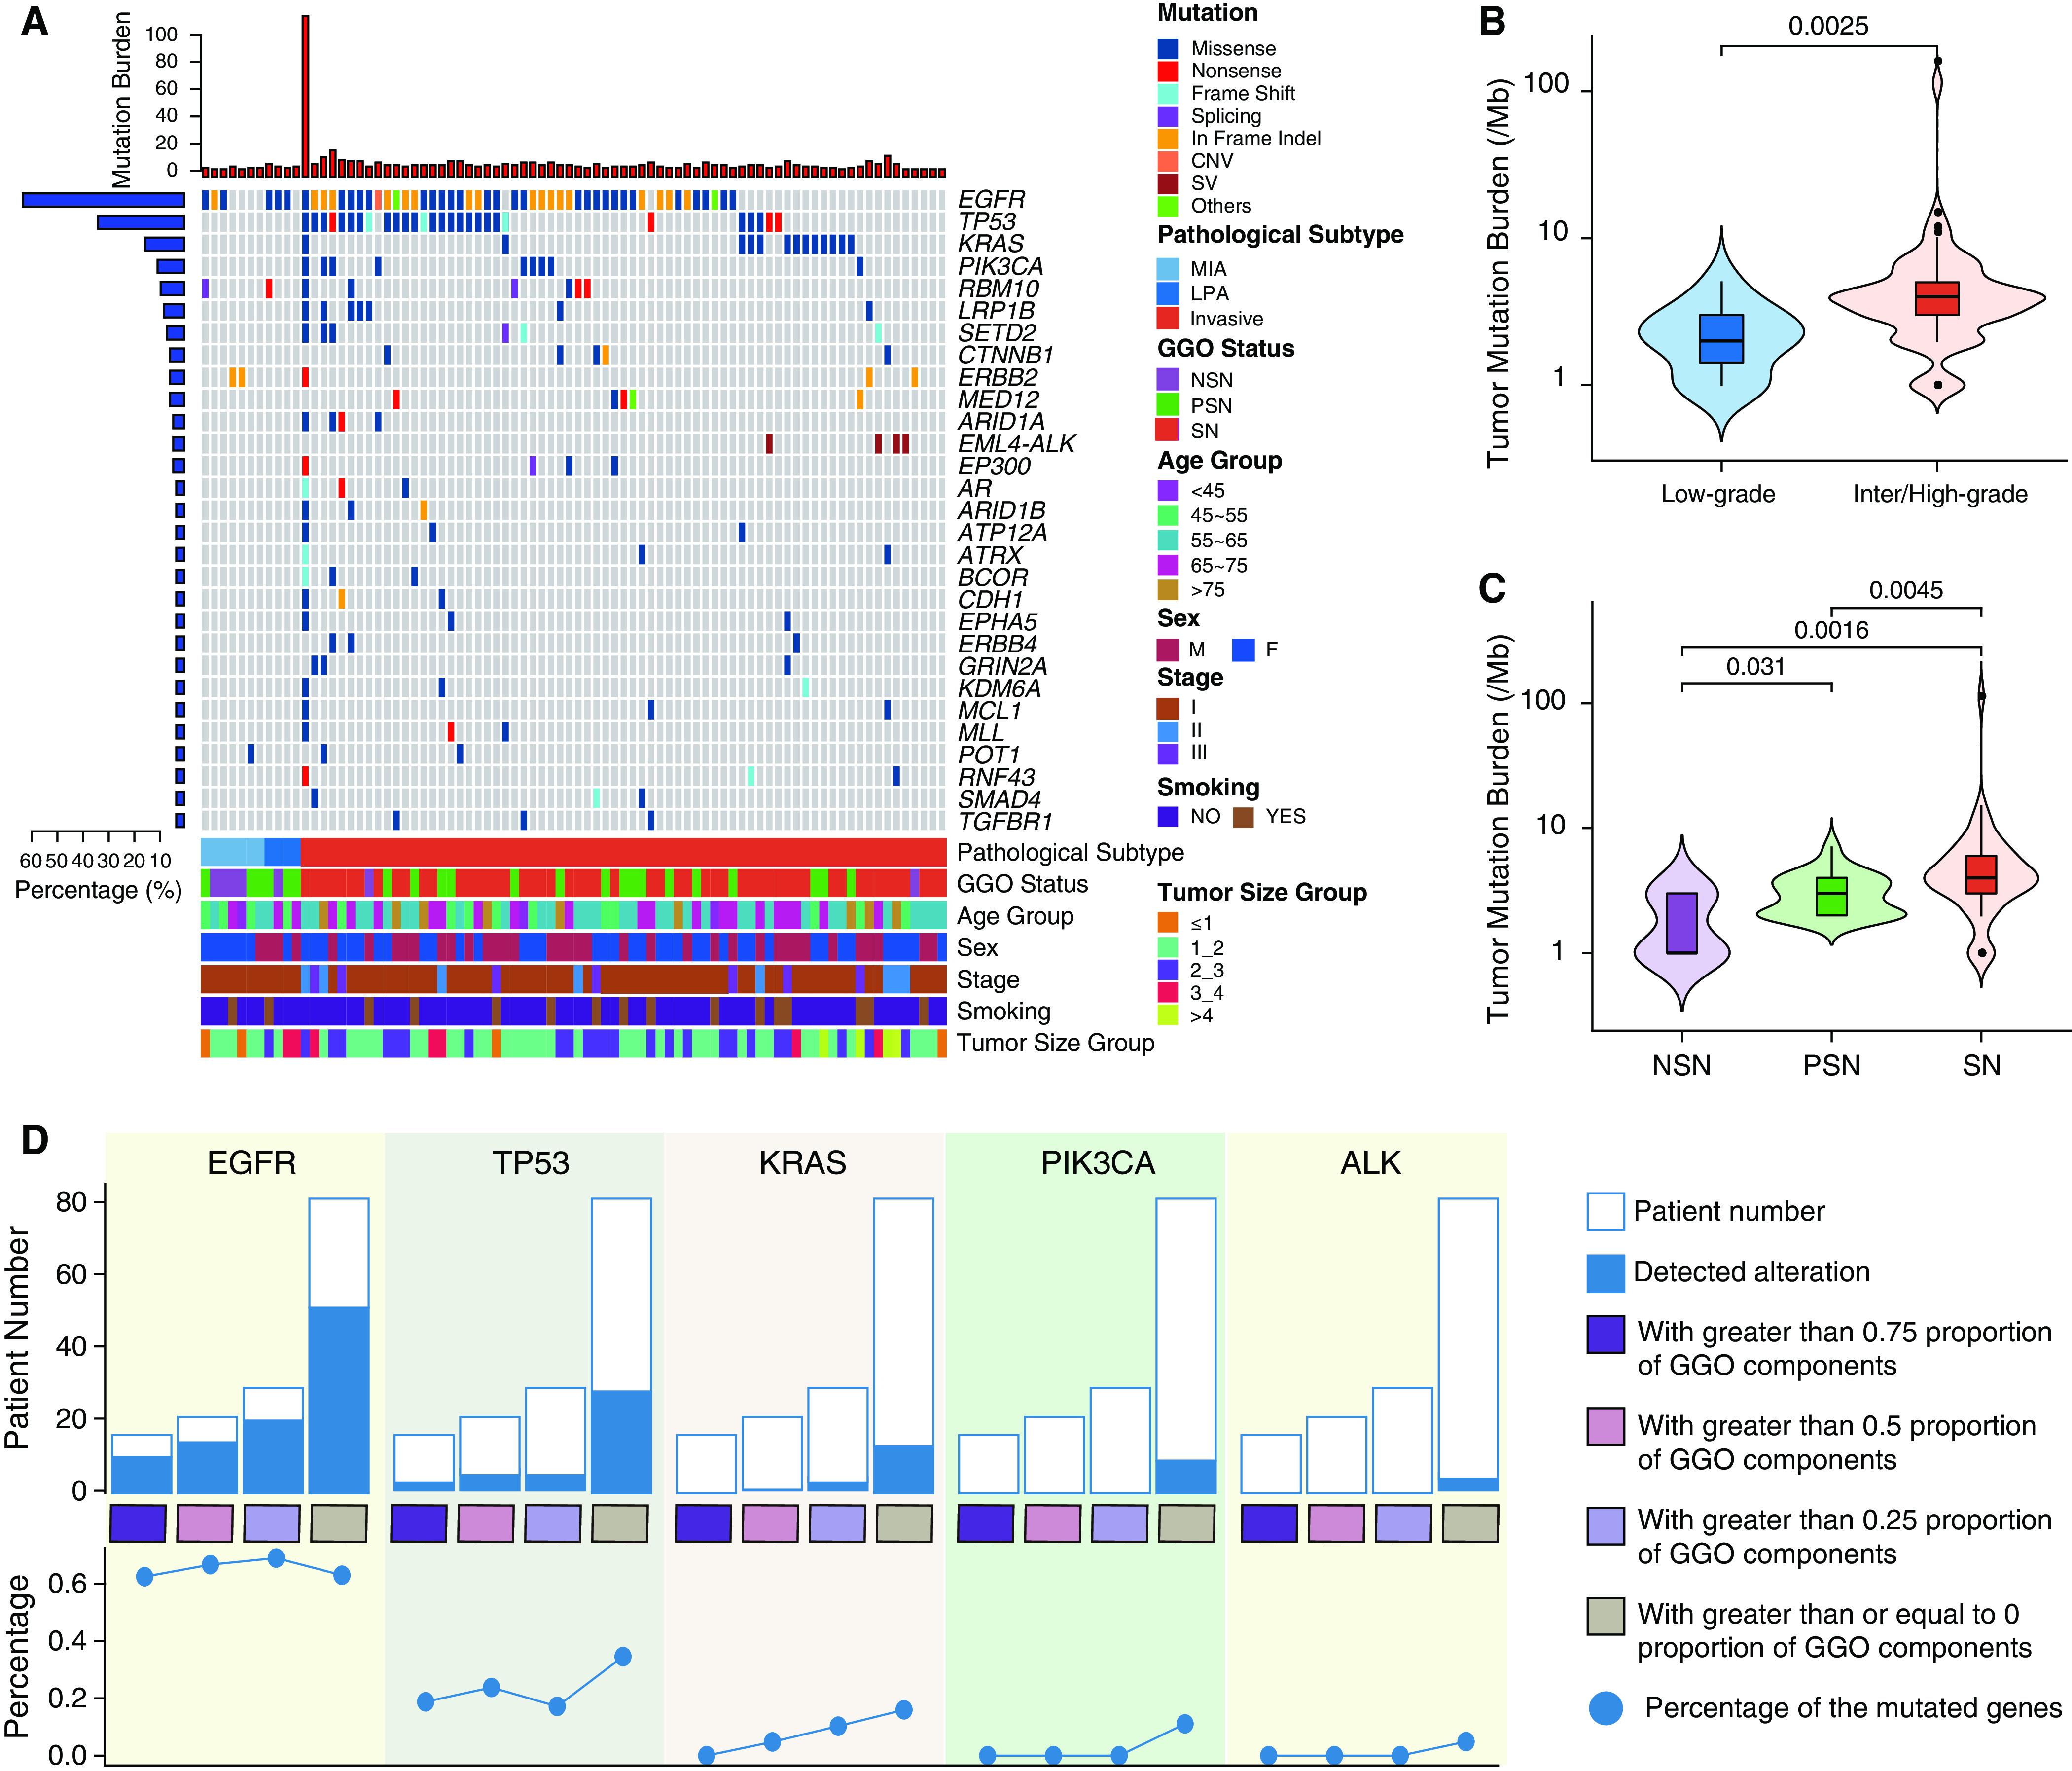
Figure 2.

Genomic landscape of lung adenocarcinoma with or without ground-glass opacity (GGO) components. (A) Top mutated cancer genes in at least three patients. Clinical features are listed at the bottom of the figure, and the number of mutated genes in each patient is shown at the top of the figure as red bars. The prevalence of mutated cancer genes in this cohort is represented as blue bars to the left of the figure. Patient PTHOG0047 with the highest tumor mutation burden in this cohort is detailed in the online supplement. (B) The association of the tumor mutation burden with low-grade (n = 11, 2.27 ± 1.19 Mut/Mb) versus intermediate or high-grade histology (n = 71, 5.74 ± 13.29 Mut/Mb) or (C) GGO status (NSN: n = 7, 1.85 ± 1.06 Mut/Mb; PSN: n = 23, 3.08 ± 1.27 Mut/Mb; SN: n = 52, 6.71 ± 15.44 Mut/Mb). N represents the sample size in each group, and the mean ± SD is also shown in brackets. (D) The incidence of commonly mutated cancer genes in lung adenocarcinomas with different proportions of GGO components (grouped as quartiles). For box plots within violin plots, each box indicates the first quartile (Q1) and third quartile (Q3), and the black horizontal line represents the median; the upper whisker is the min[max(x), Q3 + 1.5 × IQR], and the lower whisker is the max[min(x), Q1 − 1.5 × IQR], where x represents the data, Q3 is the 75th percentile, Q1 is the 25th percentile, and IQR = Q3 − Q1. The widths of the violin plots indicate the kernel density of the data. CNV = copy number variation; IQR = interquartile range; LPA = lepidic-predominant invasive adenocarcinoma; max = maximum; MIA = minimally invasive adenocarcinoma; min = minimum; Mut = mutations; NSN = nonsolid nodule; PSN = part-solid nodule; SN = solid nodule; SV = structural variation.
