Figure 4.

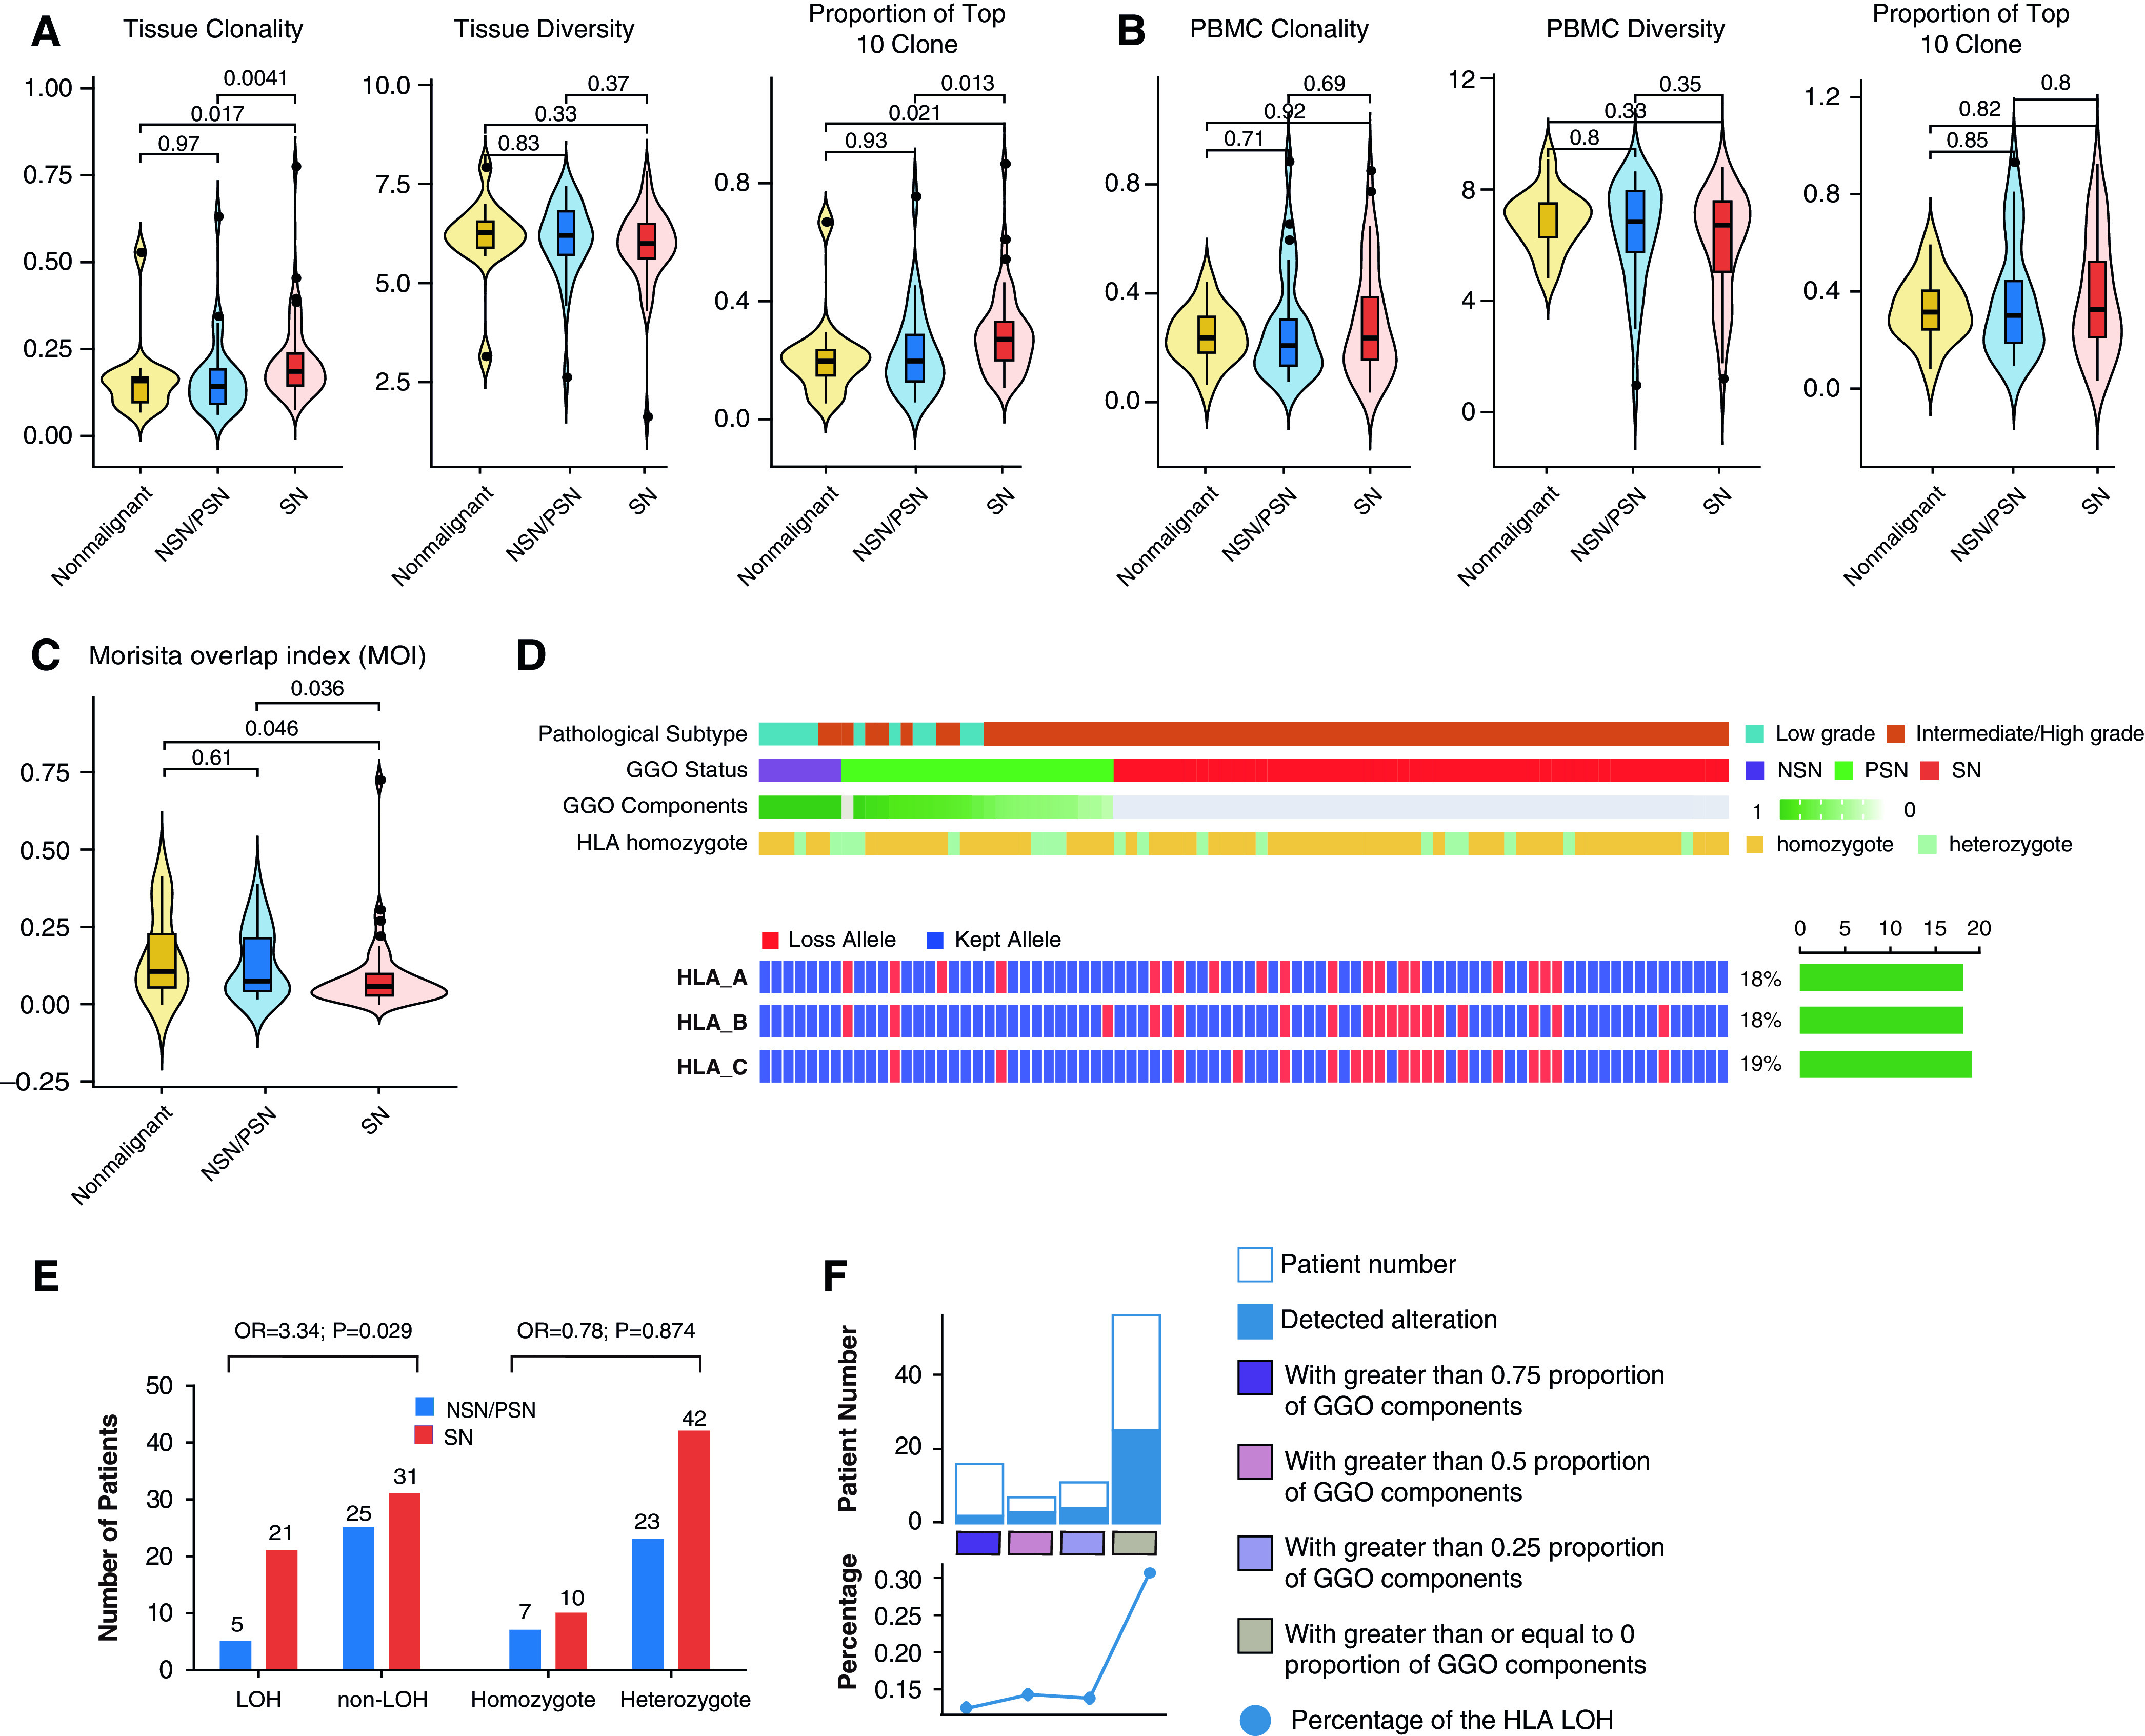
T-cell clonality (left), diversity (middle), and the proportion of the top 10 clones (right) in (A) nonmalignant nodules versus lung adenocarcinoma (LUAD) tissues with ground-glass opacity (GGO) components (NSNs/PSNs) or without GGO components (SNs) and (B) peripheral blood mononuclear cell (PBMCs). (C) Shared T-cell clones in LUAD specimens and PBMCs as quantified by using the MOI. (D) For each patient, the HLA heterozygote status and data on whether HLA-A/B/C kept or lost alleles are listed. The right bar represents the number of patients in whom HLA loss of heterozygosity (LOH) events on related HLA genes occurred. (E) Numbers of patients with HLA LOH events (left panel) and an HLA homozygous status (right) among patients with LUAD with a GGO component versus without a GGO component. P values as calculated by using the chi-square test and ORs are shown. (F) The incidence of HLA LOH events in LUADs with different proportions of GGO components (grouped as quartiles). MOI = Morisita overlap index; NSN = nonsolid nodule; OR = odds ratio; PSN = part-solid nodule; SN = solid nodule.
