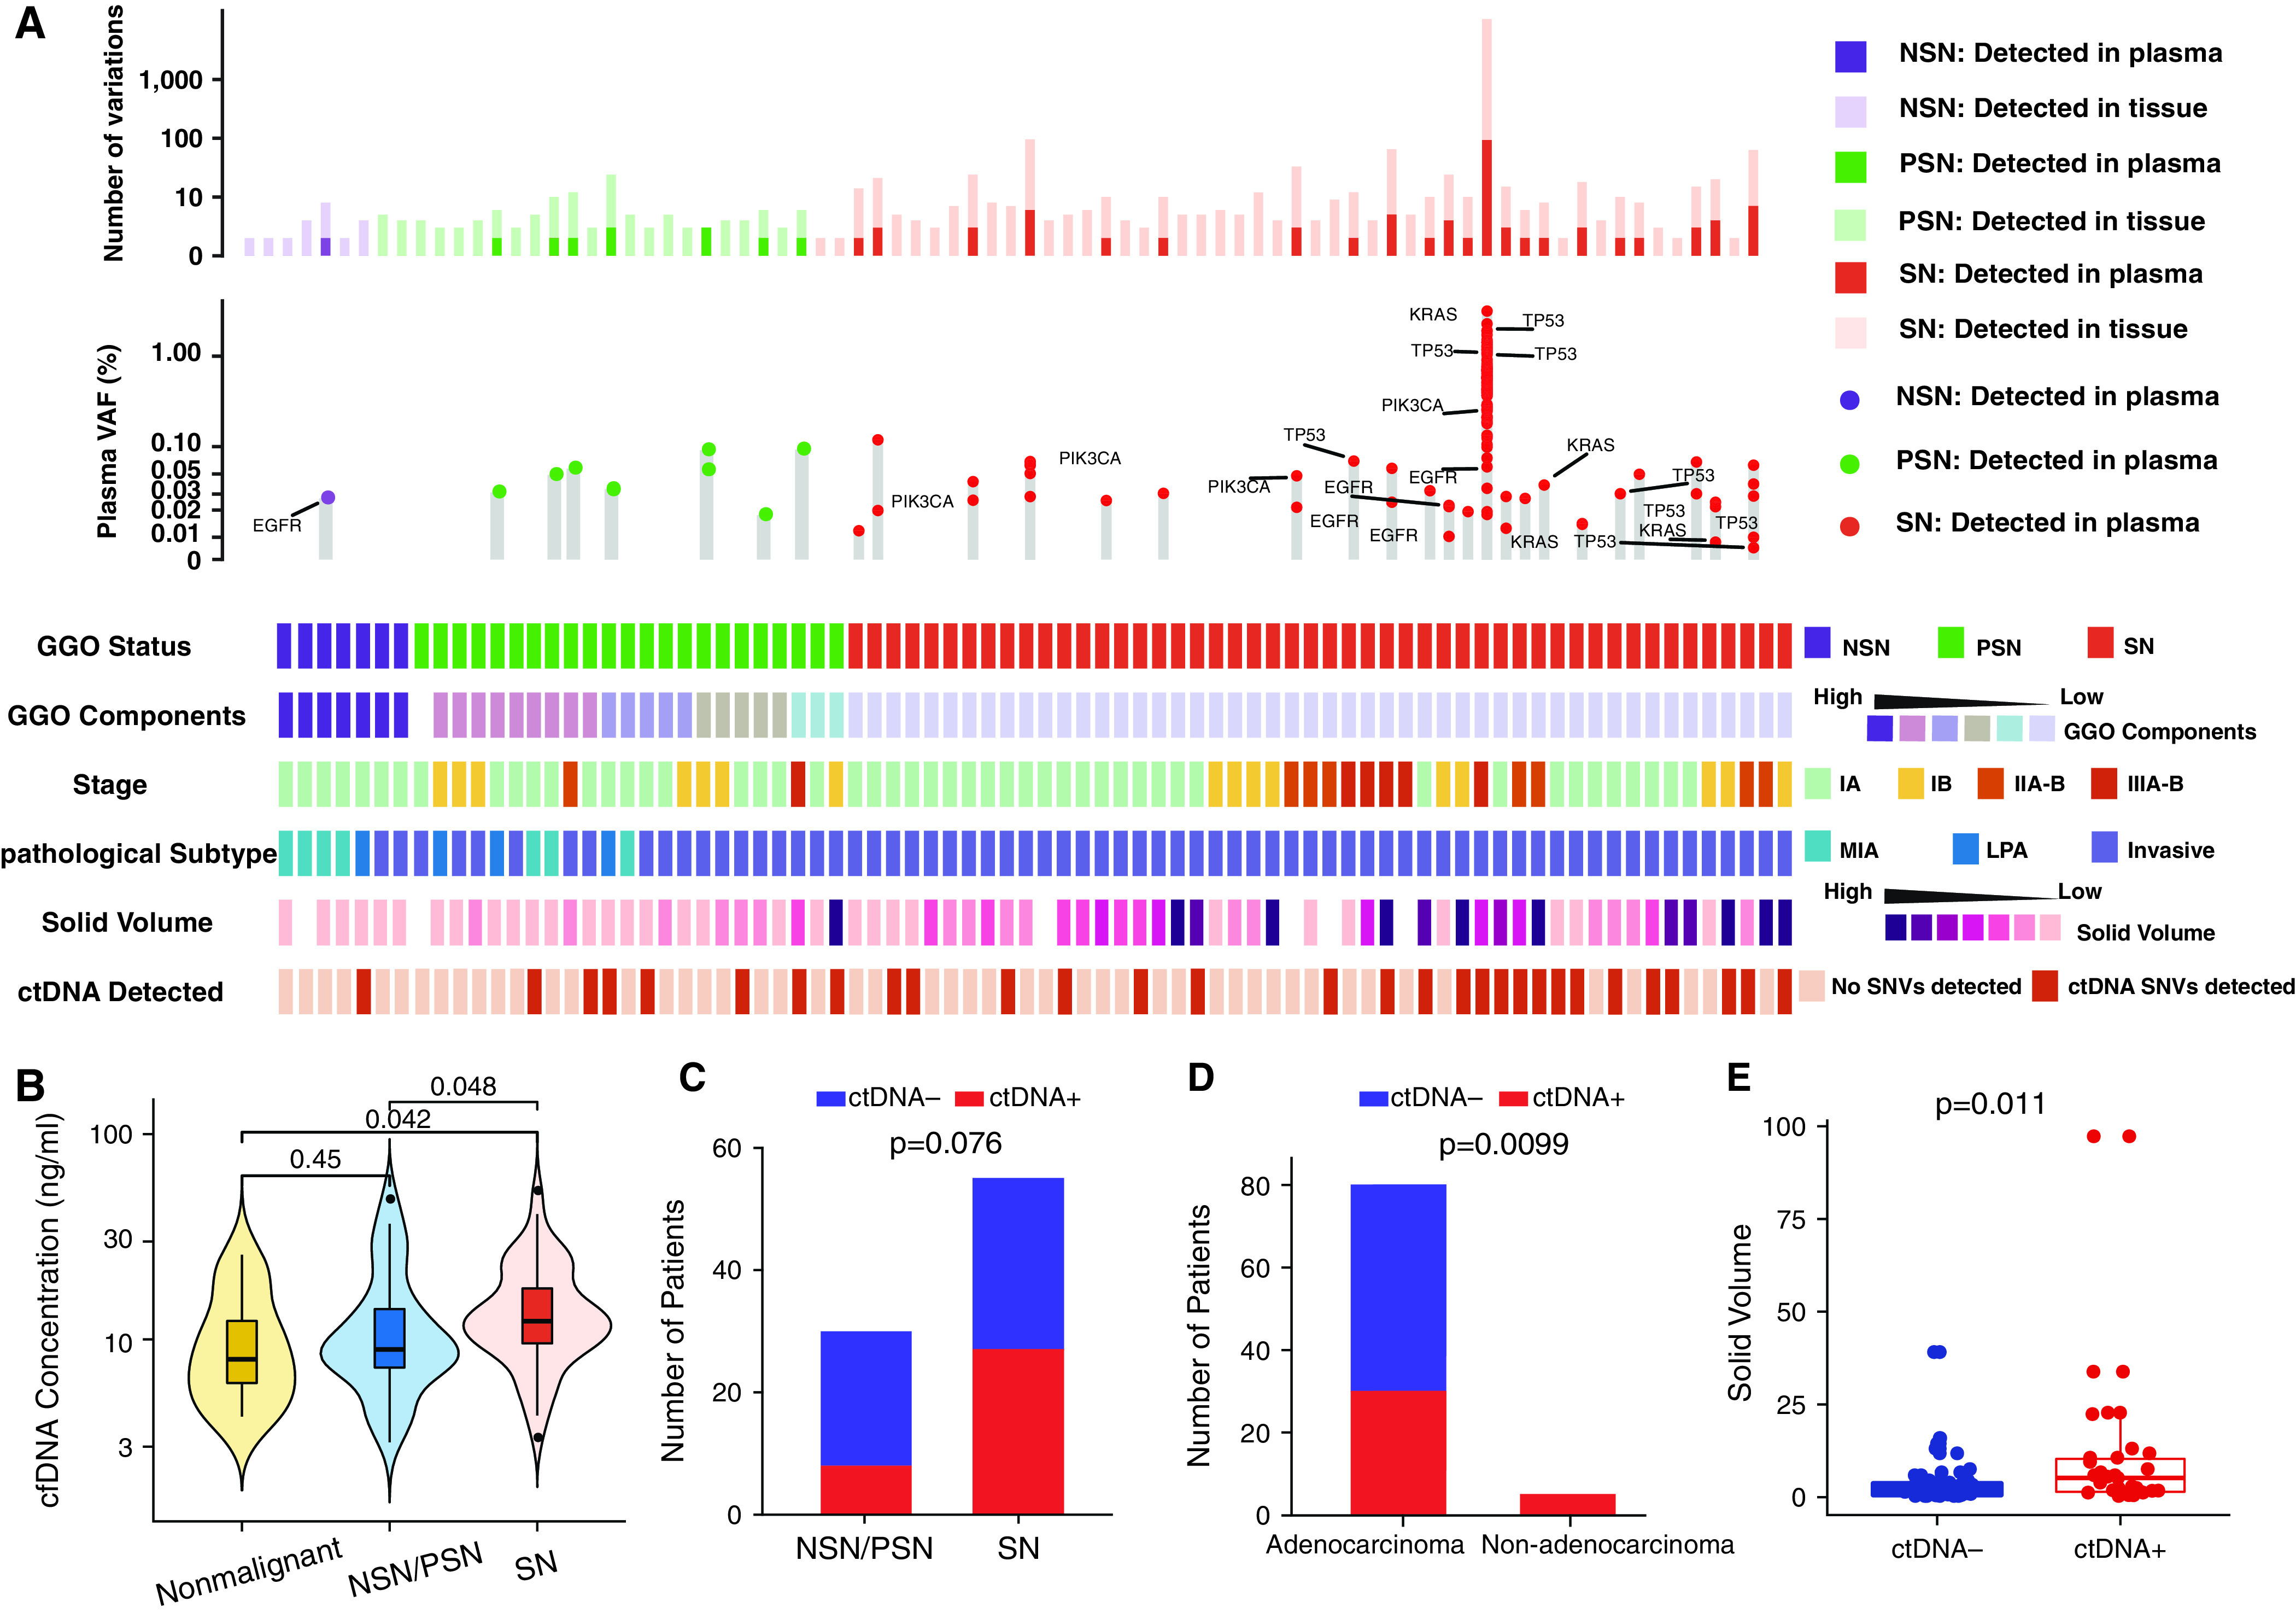
Figure 5.

Cell-free DNA (cfDNA) mutations in patients with lung adenocarcinoma with clinicopathologic features. (A) The number of variations from tissue and plasma, the VAF of driver genes detected from plasma, and clinical features in 82 patients with lung adenocarcinoma are listed. (B) The cfDNA concentration of nonmalignant lung nodules versus lung cancers presenting as SNs or NSNs/PSNs. Numbers of patients (C) with versus without GGO component and (D) with adenocarcinoma versus with nonadenocarcinoma. (E) The solid volume in circulating tumor DNA (ctDNA)-positive versus ctDNA-negative nodules. For all box plots or box plots within violin plots, each box indicates the first quartile (Q1) and third quartile (Q3), and the black horizontal line represents the median; the upper whisker is the min[max(x), Q3 + 1.5 × IQR], and the lower whisker is the max[min(x), Q1 − 1.5 × IQR], where x represents the data, Q3 is the 75th percentile, Q1 is the 25th percentile, and the IQR = Q3 − Q1. The widths of violin plots indicate the kernel density of the data. GGO = ground-glass opacity; IQR = interquartile range; LPA = lepidic-predominant invasive adenocarcinoma; max = maximum; MIA = minimally invasive adenocarcinoma; min = minimum; NSN = nonsolid nodule; PSN = part-solid nodule; SN = solid nodule; SNV = single-nucleotide variant; VAF = variant allele frequency.
