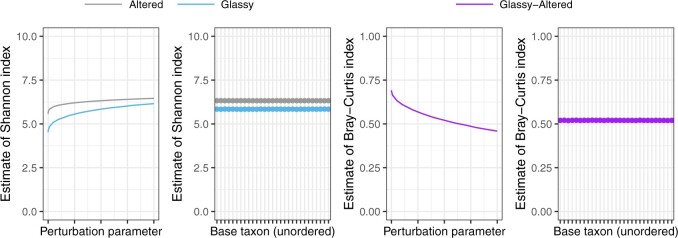
Fig. 2.
The log-ratio model described in Section 3 can only be fit to data with a minimum abundance greater than zero. Abundance data for microbiome studies are generally sparse, and 42% of the observed abundances of the Lee and others (2015) dataset are zero. For this reason, it is common to add a perturbation offset  to the observed abundance table before fitting the log-ratio model. Here, we see that the estimated diversity does depend on the choice of
  .
.

