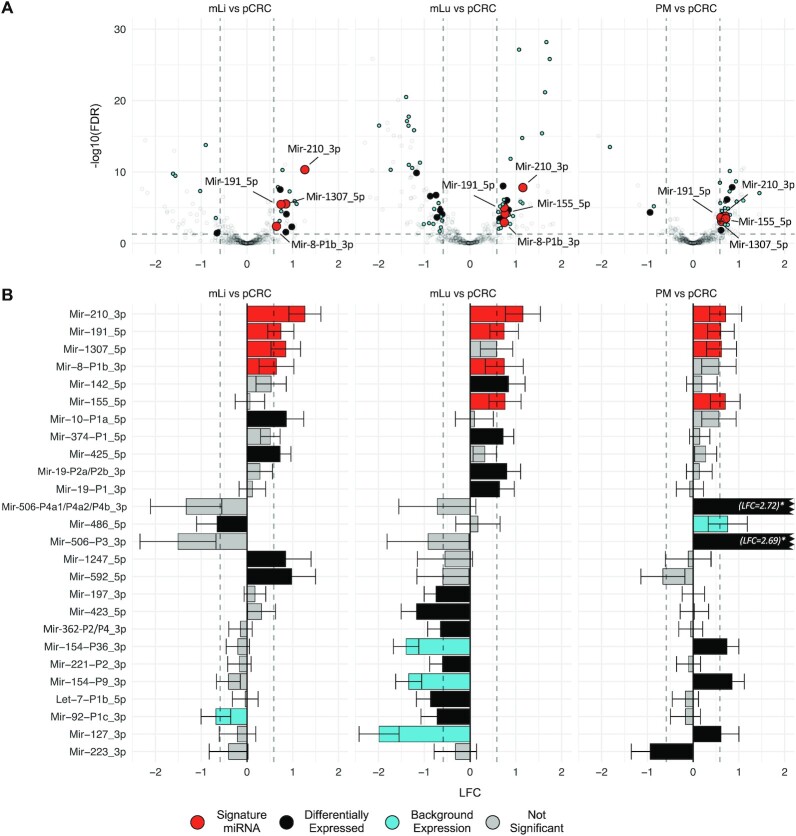
Figure 2.
Differential expression analysis identifies miRNAs associated with metastatic colorectal cancer. (A) Volcano plots showing differentially expressed miRNAs in mLi, mLu and PM compared to pCRC. The horizontal axis shows LFC relative to pCRC, while the vertical axis shows -log10 FDR. The identified miRNAs were differentially expressed between pCRC and mCRC, with expression levels >100 RPM in one of the tissues, and results were corrected for tumor adjacent background expression. (B) Bar plots of LFC of differentially expressed miRNAs in pCRC compared to the individual metastatic sites. Log2 fold change (LFC); false discovery rate (FDR); reads per million (RPM); primary colorectal cancer (pCRC); normal colorectal tissue (nCR); CRC liver metastasis (mLi); normal adjacent liver tissue (nLi); CRC lung metastasis (mLu); normal adjacent lung tissue (nLu); CRC peritoneal metastasis (PM).

