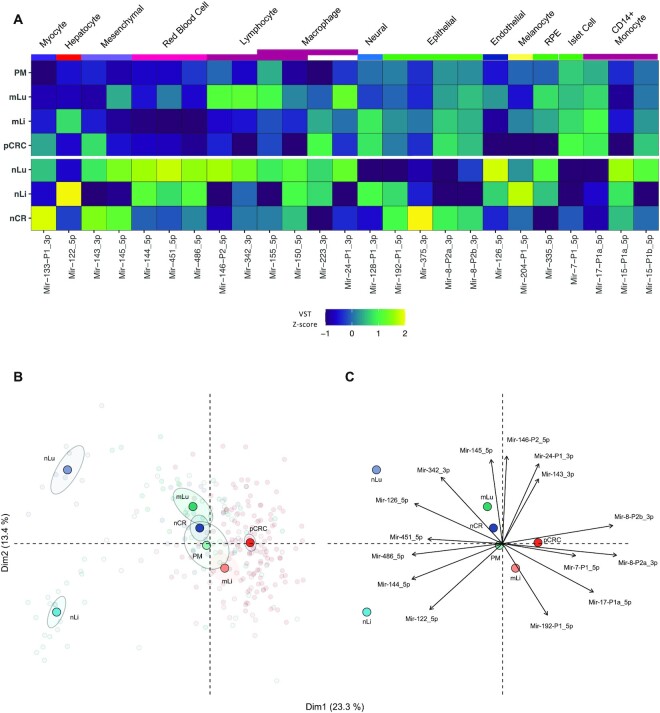
Figure 4.
Cell-type specific miRNAs provide insight into the cellular composition of tissues. (A) Heatmap illustrating the expression of 25 cell-specific miRNAs for each tissue that had mean expression >100 RPM in at least one tissue. The color scale indicates the z-score of RPM for each miRNA. (B) PCA plot based on analysis of 25 cell-specific miRNA with expression >100 reads per million, VST normalized, colored by tissue. Transparent points are individual samples, solid points represent the statistical mean and shaded ellipses is 95% confidence of the mean of each tissue. (C) The correlation circle shows PCA loadings, which are the direction and relative contribution the top 15 cell-type specific miRNAs had on clustering of each tissue. Reads per million (RPM); principal component analysis (PCA); varianceStabilizingTransformation (VST); primary colorectal cancer (pCRC); normal colorectal tissue (nCR); CRC liver metastasis (mLi); normal adjacent liver tissue (nLi); CRC lung metastasis (mLu); normal adjacent lung tissue (nLu); CRC peritoneal metastasis (PM).

