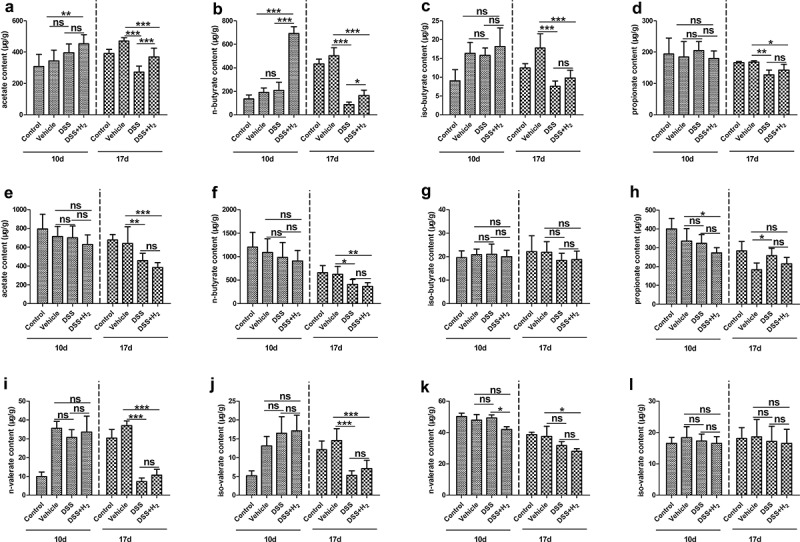
Figure 6.

HS administration affects SCFAs profiles in the cecal and fecal samples. Different SCFA concentration was determined in fecal samples and cecal contents using GC-MS before (10 d) and after (17 d) drinking DSS water. The concentration of acetate (a), n-butyrate (b), iso-butyrate (c), propionate (d), n-valerate (i) and iso-valerate (j) were determined in the fecal samples. The concentration of acetate (e), n-butyrate (f), iso-butyrate (g), propionate (h), n-valerate (k) and iso-valerate (l) were determined in the cecal contents (n = 6–8). All data show mean ± SD, are representative of two to four independent experiments, and include statistical significance calculated by one-way ANOVA with LSD multiple comparison post hoc test. ns, no significant; * P < .05; **P < .01; ***P < .001.
