
Figure 8.
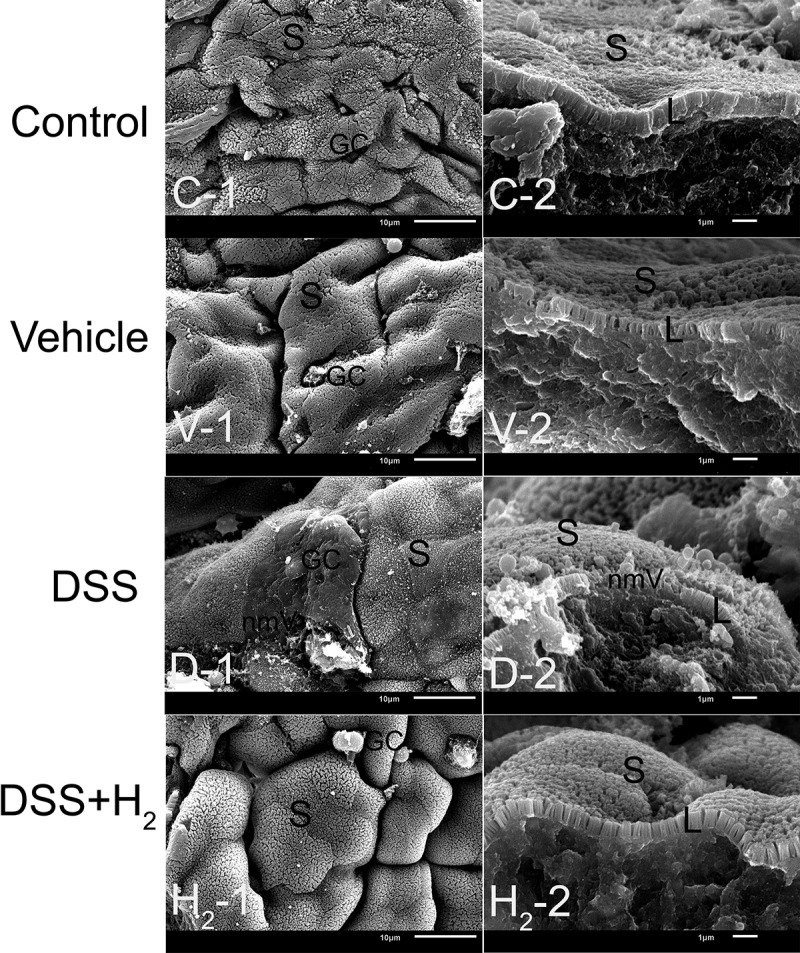
Representative scanning electron microscopy (SEM) micrographs showing the mucous layer and colonic mucosa. S: superficial section of colonic mucosa; L: Longitudinal section of microvillus; GC: goblet cell; nmV: no microvillus (n = 6). Control group includes C-1, C-2; Vehicle group includes V-1, V-2; DSS group includes D-1, D-2; DSS+H2 group includes H2-1, H2-2. Micrographs are representative of three independent experiments. (Scale bars: the first column, 10 μm; the second columns, 1 μm).