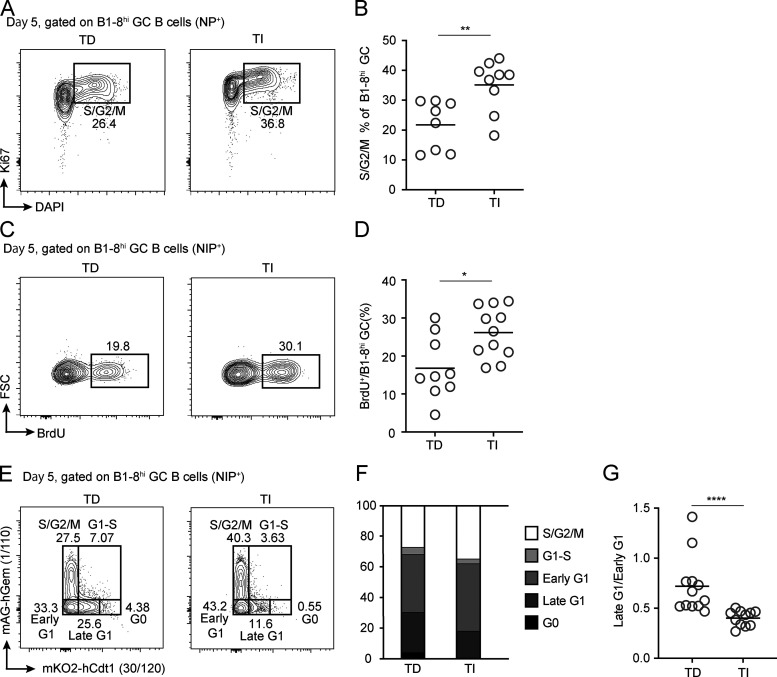
Figure 2.
Cell cycle analyses of TD and TI GCs. (A and B) DNA contents and Ki67 expression of B1-8hi TD and TI GC B cells. Representative FACS profiles (A) and summary statistics of cells in S/G2/M phase of cell cycle (B). (C and D) Acute BrdU incorporation in B1-8hi TD and TI GC B cells. Representative FACS profiles (C) and summary statistics of B1-8hi GC B cells incorporating BrdU after 30-min pulse (D). (E–G) TD and TI GCs analyzed with the FUCCI cell cycle reporter. (E) FACS plots showing cell cycle profiles of B1-8hi TD and TI GC B cells, respectively, as enabled by the expression of the FUCCI reporter. (F) Percentages of B1-8hi TD and TI GC B cells in different cell cycle stages. G0, mKO2hi; S/G2/M, mAG+; G1–S, mAG+mKO2+; early G1, mAG−mKO2−; late G1, mKO2lo. (G) The ratio of late G1 to early G1 cells in B1-8hi TD and TI GCs. All summary data were pooled from three independent experiments with at least two mice per group. In scatter plots, each symbol indicates one mouse, and lines denote means. P values by Student’s t test (B and D) or Mann–Whitney U test (G). *, P < 0.05; **, P < 0.01; ****, P < 0.0001.

