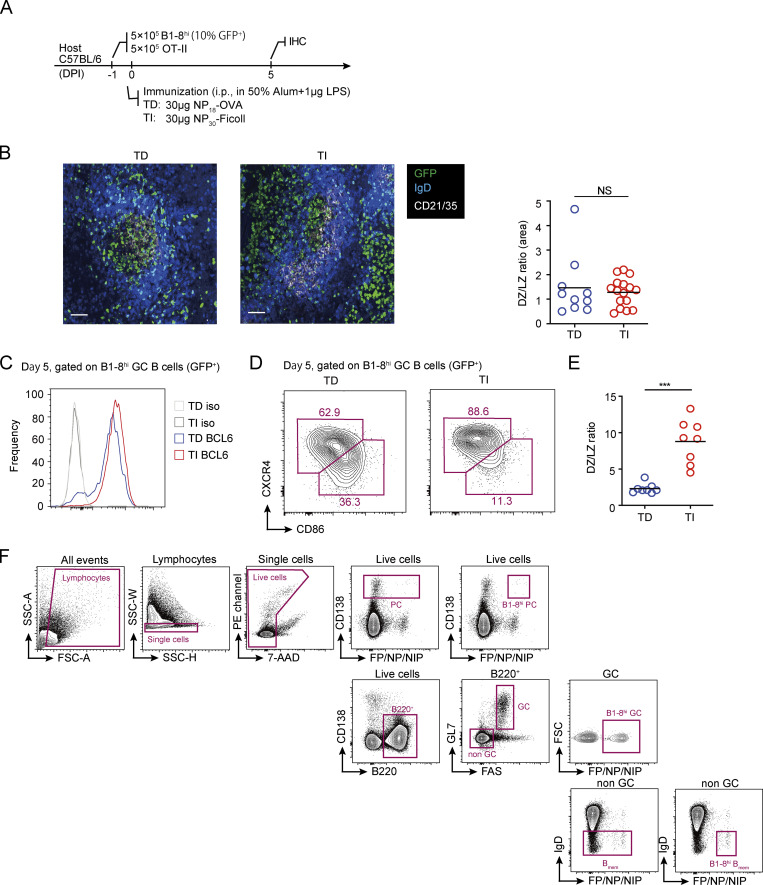
Figure S1.
DZ-LZ polarization in TI GCs. (A) Experimental outline. TD and TI GCs were constructed as described in Fig. 1. (B) Immunohistochemical staining of spleen sections from mice bearing TD and TI GCs, respectively (left). The ratio between the area occupied by DZ and LZ was calculated (right). The GC area was defined by clearance of IgD+ naive follicular B cells, and the LZ was defined by the presence of CD21+ follicular dendritic cells. Scale bar denotes 100 µm. Data were representative of two independent experiments, with at least two mice analyzed in each group. Each symbol indicates one GC, and lines denote means. (C) FACS analysis of BCL6 expression levels in TD and TI B1-8hi GC B cells. (D and E) FACS analysis of DZ and LZ phenotype cells within B1-8hi GCs. (D) FACS plots showing gatings of DZ and LZ cells in TD and TI GCs, respectively. DZ cells were gated as CXCR4hiCD86lo, and LZ cells were gated as CXCR4loCD86hi. (E) Quantification of DZ/LZ ratio in B1-8hi TD and TI GCs based on data in B. Data were pooled from three independent experiments with at least two mice per group. Each symbol indicates one mouse, and lines denote means. (F) Gating strategies for B1-8hi GC B cells, Bmem cells, and PCs. P values by Mann–Whitney test. ***, P < 0.001.

