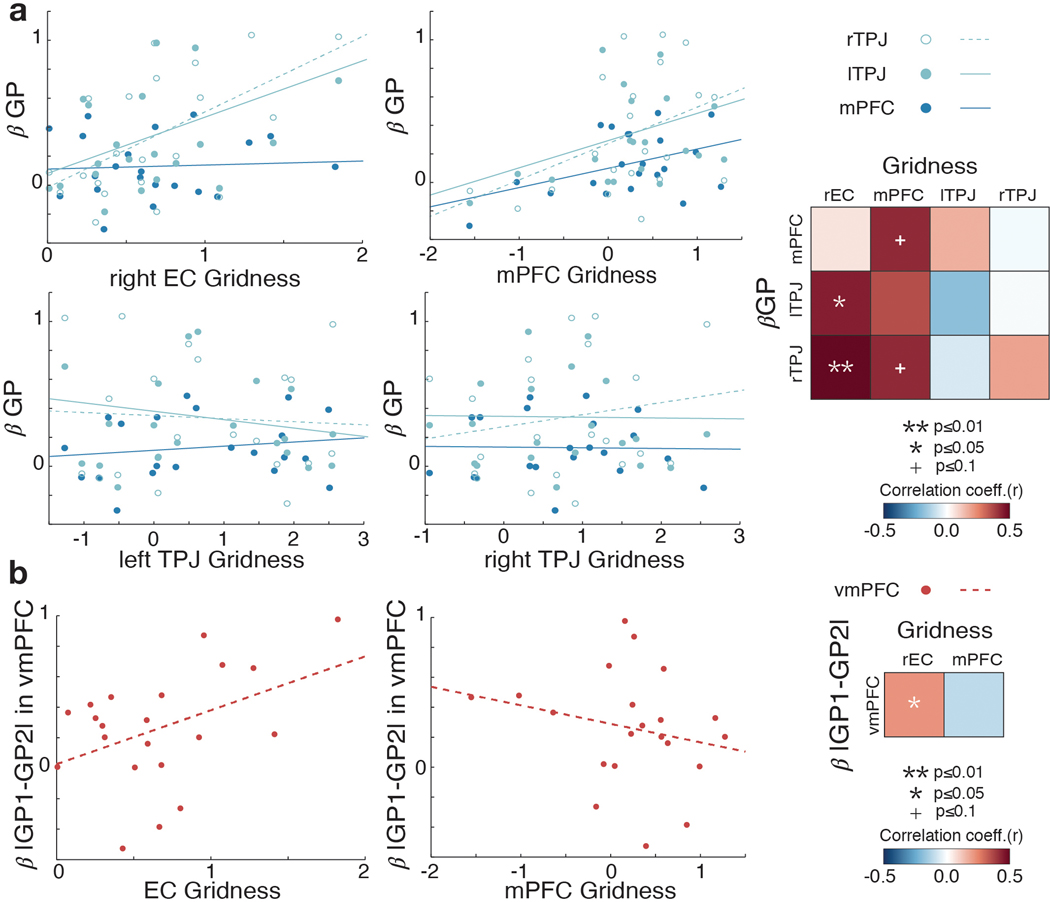
Extended Data Fig. 5. Individual differences in the relationship between the gridness and the effects of growth potential.
a. In addition to the relationship between EC gridness (β cos(6[θ − Ψ])) and GP effects (βGP) in bilateral TPJ that we present in Figure 5c (upper left), we found a marginal positive correlation between the mPFC gridness and GP effects in mPFC and right TPJ (p<0.1) (upper middle). The gridness estimated in TPJ, however, does not correlate with their GP effects nor with the mPFC GP effect (p>0.1) (bottom left and middle). **, p<0.01; +, p<0.01. To further examine the relationship between the EC and mPFC gridness, we formally test which one better explains the GP effects in TPJ and mPFC. To address this question, we inputted the z-scored gridness of EC and mPFC into the same GLM to predict the GP effects in TPJ and mPFC. We found that the GP effect in bilateral TPJ was better explained by the EC gridness than the mPFC gridness (regression coefficient βEC=0.24** > βmPFC=0.17* for right TPJ; βEC=0.16* > βmPFC=0.13 for left TPJ; **, p<0.01 and *, p<0.05), and the GP effect in mPFC was better explained by the mPFC gridness than the EC gridness (βmPFC=0.09 (p=0.066) > βEC=0.01). Right: Colormap in matrix depicts regression coefficients for each regions’ gridness effect used to explain each regions’ GP effect. b. Left:Positive correlation between effects of differences in GP (|GP1−GP2|) in vmPFC during partner selection decisions and the EC gridness (r=0.43, p=0.05) but not mPFC gridness (r=−0.22, p=0.33). Right: Colormap shows regression coefficients for rEC and vmPFC gridness effects used to predict the vmPFC value difference effect. **, p<0.01; *, p<0.05; +, p<0.1. Box, lower and upper quartiles; line, median; whiskers, range of the data excluding outliers; +, the whiskers’ range of outliers.

