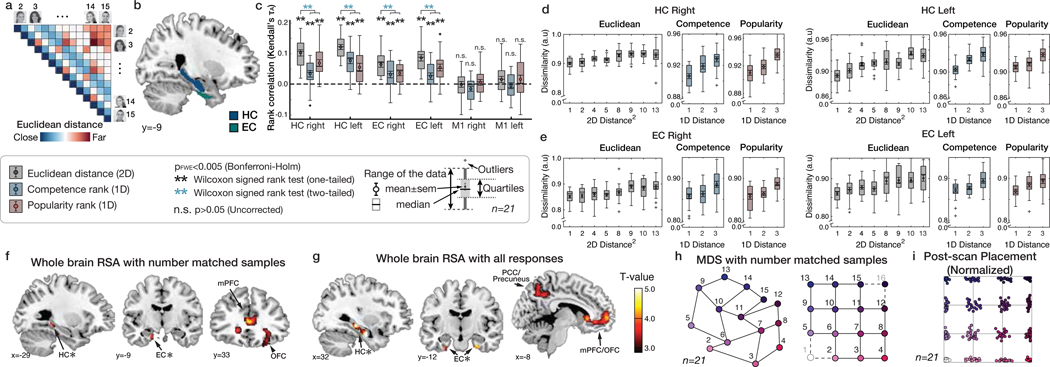
Figure 3. Building a 2-D representation of a social hierarchy.
a. Model representational dissimilarity matrix (RDM) computed from the pairwise Euclidean distances between individuals on the true 2-D social hierarchy. b. The extent to which the model RDM explained the pattern dissimilarity in ROIs. c. RSA based on equal sampling of 14 faces (by down-sampling). The rank correlation (τA) shows robust effects of Euclidean distance (gray) compared to the permuted baseline (1000 iterations; dashed line), but not in a control region, M1 (one-tailed Wilcoxon signed rank test). The τA of the Euclidean distance was significantly greater than the one-dimensional rank distance in each ROI (two-tailed Wilcoxon signed rank test) (Supplementary Table 2; pFWE<0.005, Bonferroni-Holm correction). d and e. The pattern dissimilarity in HC and EC increases in proportion to the pairwise Euclidean distance between individuals (gray), as well as with the two component 1-D rank distances (blue and red). For display purposes, the dissimilarity level was normalized to account for individual differences in scales (n=21). c, d, and e. Box, lower and upper quartiles; line, median; whiskers, range of the data excluding outliers; +, the whiskers’ range of outliers. f. Whole-brain searchlight RSA based on equal sampling of 14 faces at all events (F0, F1, and F2 presentations). g. Whole-brain searchlight RSA including all observations. The activity patterns in the HC, EC, mPFC/mOFC, and PCC/precuneus are explained by the model RDM for pairwise Euclidean distance (whole-brain TFCE correction, pFWE<0.05, except for HC and EC which was corrected using a priori ROIs [denoted by ✻]). h. Visualization of the group representation of the social hierarchy in a 2-D space using MDS on the neural activity extracted from the HC ROIs. The MDS (left) captures the true social hierarchy structure (right) better than random configurations (p<0.01 compared to 1000 random permutations; Extended Data Figure 1). i. Post-scan placement task. All participants successfully placed faces according to their ranks in a 2-D social hierarchy space. Each participant’s responses were rescaled according to their longest distances. Each dot indicates the face position placed by a single participant and colors indicate the ranks in the true social hierarchy.

