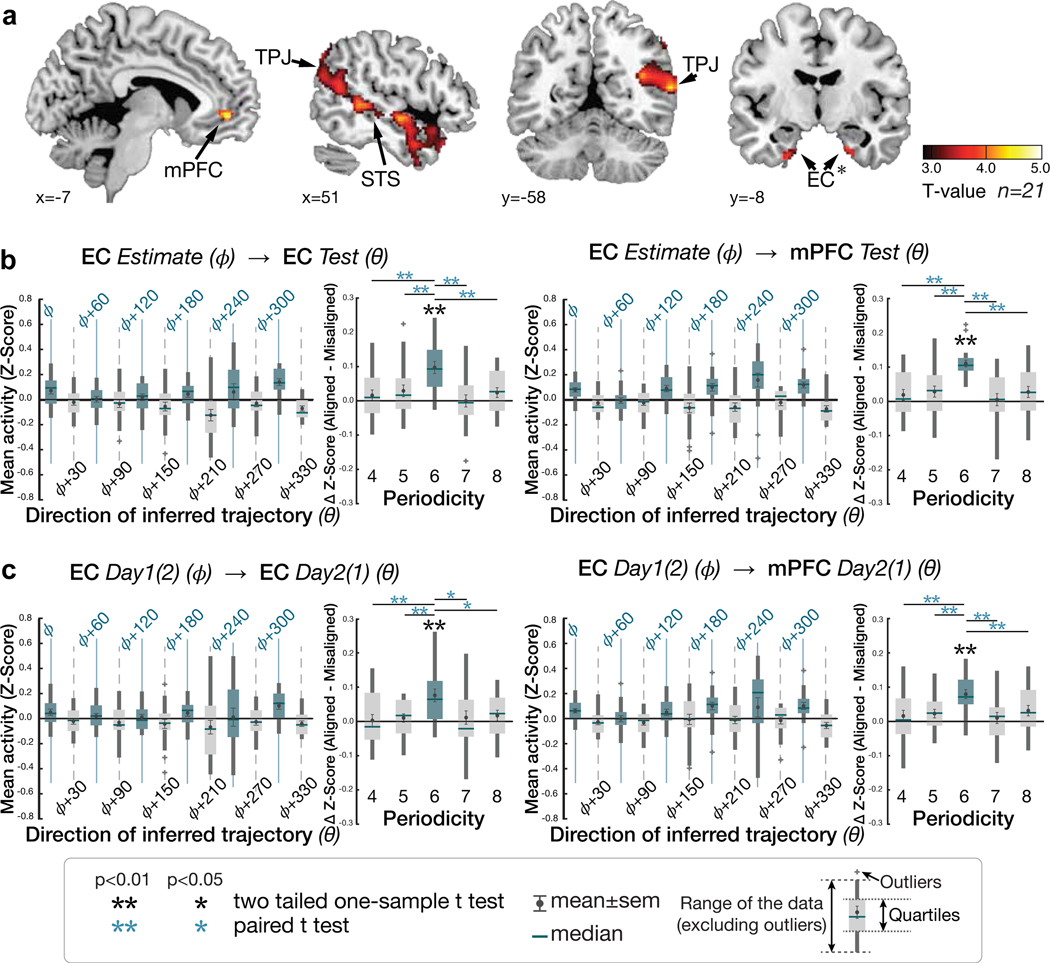
Figure 4. Hexagonal modulation for inferred trajectories.
a. Whole-brain parametric analysis showing hexagonal grid-like representation of inferred trajectories in alignment with the mean EC grid orientation at the time of F1 and F2 presentations. Significant effects are shown in EC (peak MNI coordinates, [x,y,z]=[22,−10,−28], t=4.11), mPFC ([−6,48,−4]; t=4.72), STS ([50,−40,4], t=4.05 for right; [−60,−24,−6], t=4.29 for left), TPJ ([46,−58,20],t=3.67 for right; [−56,−68,24], t=5.71 for left) (all pTFCE<0.05, whole-brain cluster corrected using threshold-free cluster enhancement (TFCE)), and EC (peak MNI coordinates, [x,y,z]=[22,−10,−28], t=4.11) (pFWE<0.05 TFCE correction within a priori anatomical ROI). The maps are displayed at a cluster-corrected threshold pTFCE< 0.05 over the whole brain for all brain regions, except for the EC, where we used a threshold of pTFCE< 0.05 corrected within anatomically defined ROI (denoted by ✻ next to EC), due to our strong a priori hypothesis of grid coding in EC 7,24(Supplementary Table 5). b. Six-fold modulation signals in the EC (left panel) and mPFC (right panel) ROIs aligned to the grid orientation in EC. The grid orientation was estimated from separate fMRI sessions acquired from the same day. The mean (±SE) z-scored activity is plotted separately for aligned (teal) and misaligned (gray) trajectories categorized into 12 equal bins of 30° according to the direction of inferred trajectories. The mean activity difference between aligned and misaligned trajectories was larger than zero for six-fold (p<0.01) but not for the other control periodicities (four-, five-, seven- and eight-fold; all p>0.05) (two-tailed one-sample t test), and the activity difference is greater for six-fold compared to the other periodicities (p<0.05; paired t test). c. Cross-day consistency of the grid orientation in EC (See Extended Data Figure 3e for whole brain analysis). The activity in EC and mPFC shows hexadirectional modulations for the inferred trajectories in alignment with the grid orientation in EC estimated from separate sessions acquired from a different day more than a week apart. This effect is also specific to the six-fold (p<0.01) periodicity (all p>0.05), suggesting that the mean grid angle in EC is consistent between sessions more than a week apart (Supplementary Table 6).

