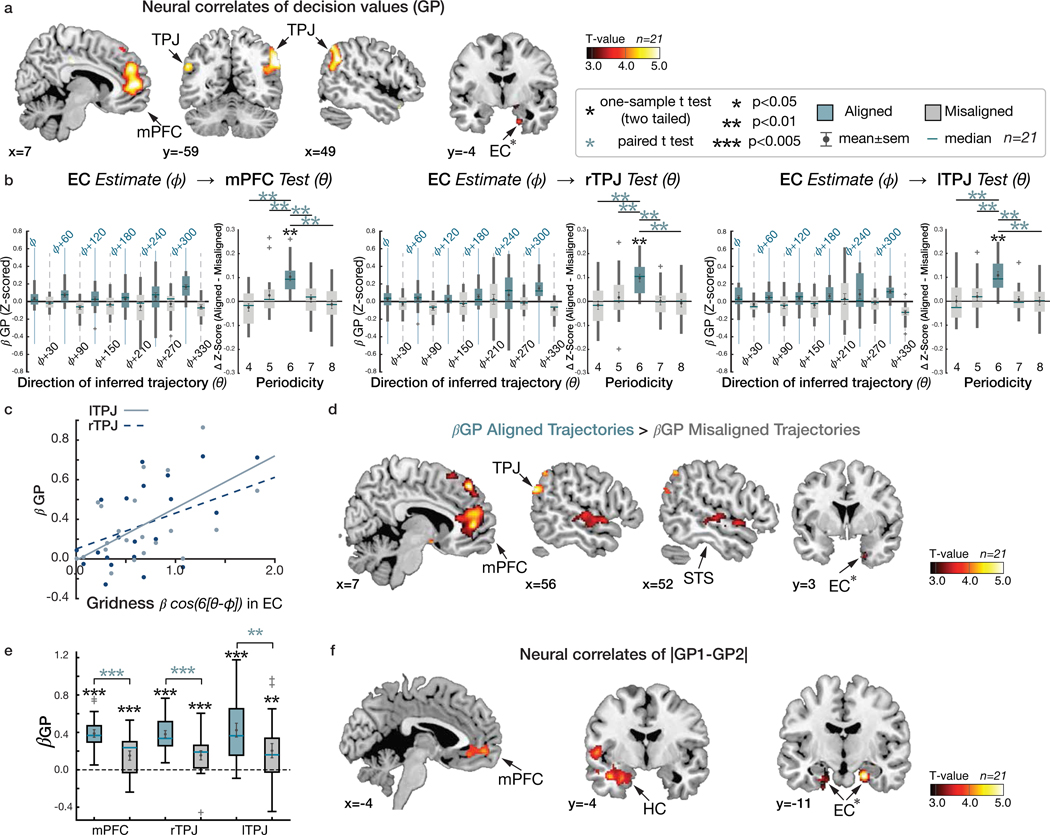
Figure 5. Growth potential and value comparison.
a. Whole-brain map showing effects of the “growth potential” (GP) at the time of F1 and F2 presentation in a network of brain regions including the mPFC (peak MNI coordinates, [x,y,z]=[10,52,6], t=5.55) and bilateral TPJ ([54,−56,34], t=5.45) for right; [−54,−60,28], t=5.18) for left) (pTFCE<0.05 whole brain TFCE correction). The EC ([x,y,z]=[20,−4,−32], t=3.88) also showed GP effects. b. Mean (±SE) effects of GP (z-scored β) in mPFC and bilateral TPJ are modulated by the grid alignment of the inferred trajectories, θ, with six-fold periodicity aligned with the EC grid orientation, . Control analyses confirmed specificity for this six-fold periodicity (p<0.01) over control periodicities (effect of six-fold compared to other control periodicities, all p<0.05; Supplementary Table 6). c. Those participants with greater hexagonal modulation in EC show greater encoding of GP in independently defined bilateral TPJ ROIs (all p<0.05; Extended Data Figure 5). d. Whole-brain map contrasting the effects of GP (β GP) for trajectories aligned with the EC grid orientation, , compared to the misaligned trajectories (β GP aligned > β GP misaligned: pTFCE<0.05 whole brain TFCE correction). Contrasts are shown in mPFC, EC, STS, and TPJ. e. Mean (±SE) GP effects in anatomically defined mPFC, and bilateral TPJ ROIs (β GP). In all three areas, effects were greater for aligned compared to misaligned trajectories (all p<0.01), although the GP effects of both trajectories were significant (all p<0.01). b and e. Box, lower and upper quartiles; line, median; whiskers, range of the data excluding outliers; +, the whiskers’ range of outliers. f. Neural correlates of the relative decision value, |GP1-GP2|, during decision making, in vmPFC ([−8,54,−6]; t=5.07), HC ([−28,−4,−26]; t=4.53) (pTFCE<0.05), and bilateral EC ([22,−12,−26], t=5.10 for right; [−26,−16,−32], t=4.00 for left; pTFCE<0.05 TFCE corrected in a priori ROIs). ***, p<0.005; **, p<0.01; *, p<0.05. All the maps are displayed at a cluster-corrected threshold pTFCE < 0.05 over the whole brain for all brain regions, except for the EC, where we used a threshold of pTFCE < 0.05 corrected within our anatomically defined ROI (denoted by ✻ next to EC).

