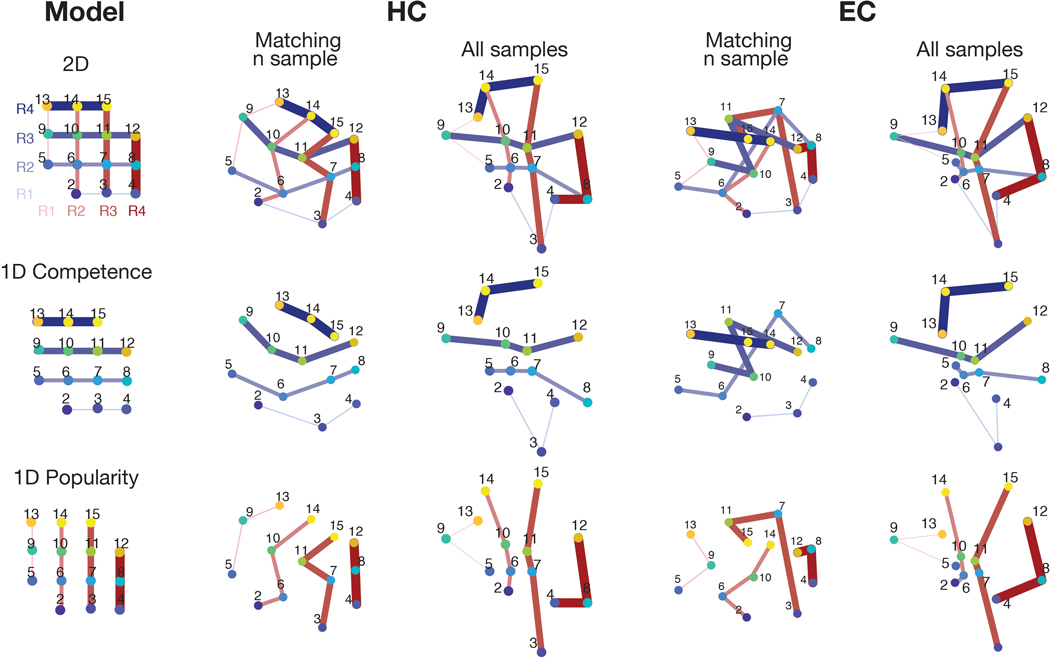
Extended Data Fig. 1. Multidimensional scaling (MDS).
Visualization of the group representation of the social hierarchy in a 2-D space using MDS on the neural activity extracted from the HC and EC ROIs. There were considerably fewer presentations of individuals at the rank positions 1 and 16, making their estimates less reliable, and so these less frequently sampled individuals were excluded in computing the MDS. The 2-D representations (top) can be factorized into two 1-D hierarchies: competence (middle) and popularity (bottom). The lines indicate the individuals at the same rank in the social hierarchy. The thicker the line, the higher the rank in the given dimension. a. The MDS computed from the mean pattern dissimilarity across participants after matching the number of samples per face. Numbers indicate face position as shown in the true hierarchy in the Model on the left. Blue colors correspond to competence the dimension and red to the popularity dimension. The distances and angles between the estimated individual locations in the HC and EC MDS are significantly correlated with the pairwise Euclidean distances (Spearman’s ρ = 0.84 for HC and ρ = 0.63 for EC) and cosine angles (ρ = 0.93 for HC and ρ = 0.71 for EC) in the true 4×4 social hierarchy structure, compared to random configurations (both p<0.01 compared to 1000 random permutations). b. The MDS estimated from the mean neural activity patterns including every presentation of the 14 face stimuli. Associated with Figure 3g and Extended Data Figure 2.

