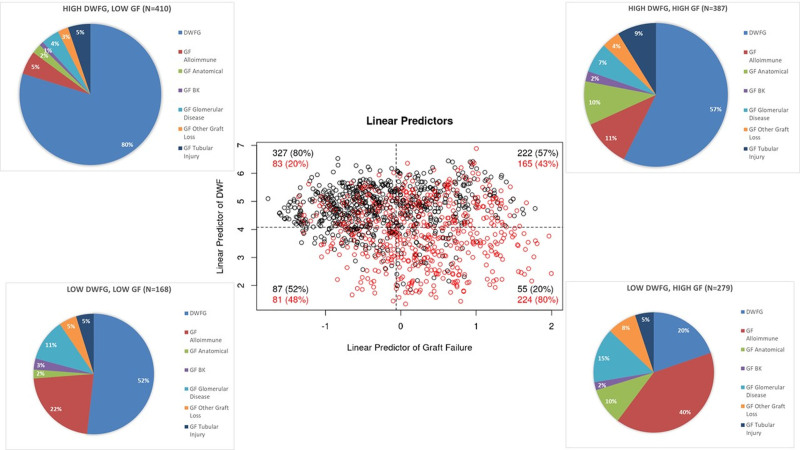
FIGURE 3.
Overlap of risk scores for either DWFG or GF patients at baseline in patients who developed graft loss. In patients who develop either DWFG or GF, we generated risk scores for each outcome based on factors present at the time of transplantation. A, Scatter plot of the linear predictor from cause-specific Cox regression models for GF showing high-risk scores (earlier the overall mean) in many patients. A red circle indicates the patient who actually developed GF, and a black circle indicates the patient who actually developed DWFG. Each quadrant percentage for GF is displayed to represent the different causes of graft loss. BK, polyoma virus; DWFG, death with a functioning graft; GF, graft failure.

