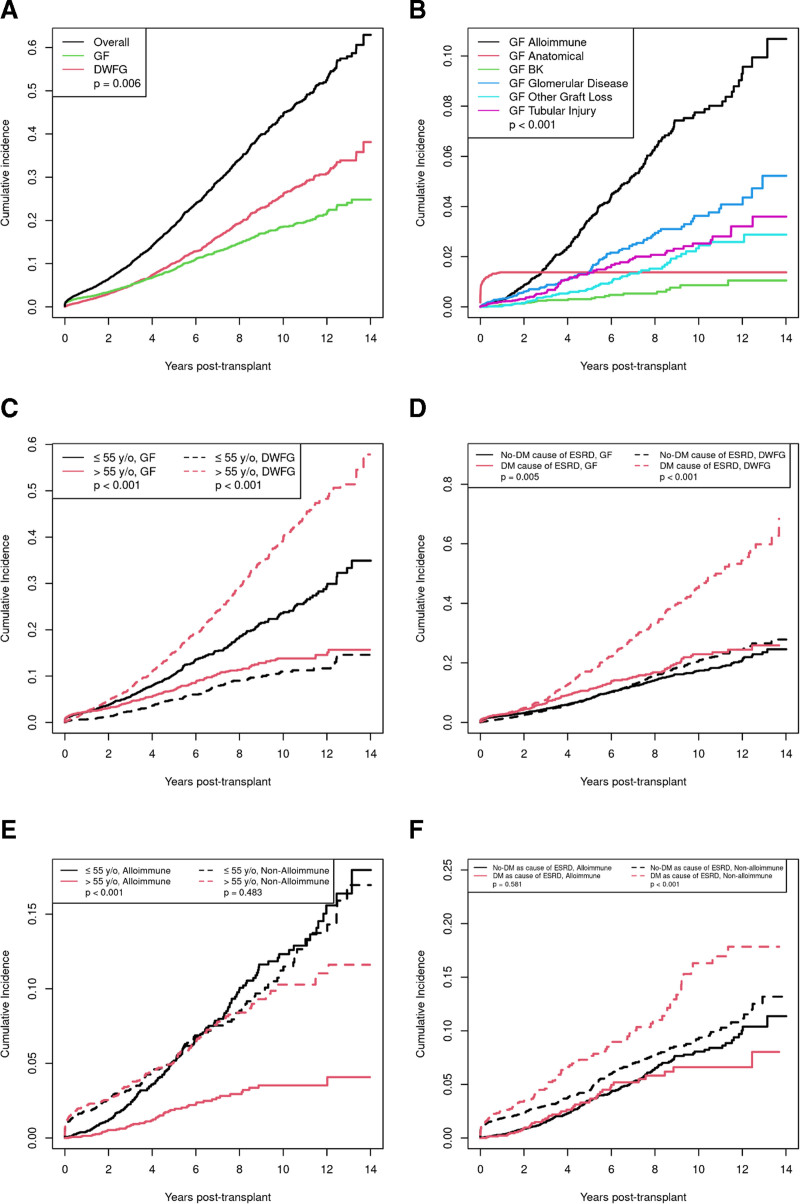
FIGURE 4.
Competing risk cumulative incidences of GF and DWFG. A, Overall graft loss, GF, and DWFG. DWFG is more common over time than GF (P = 0.006). B, Incidence curves for each type of GF. Alloimmune causes are more common than all other causes (P < 0.001 comparing restricted mean survival). C, GF and DWFG for recipients <55 y old vs >55 y old. GF is higher in younger group (P < 0.001), and DWFG is higher in older recipients (P < 0.001). D, GF and DWFG in recipients stratified by diabetes as the cause of ESRD. DWFG is more common in diabetics (P < 0.001), whereas GF is similar in diabetics and nondiabetics (P = 0.071). E, GF due to alloimmune and nonalloimmune causes for recipients <55 vs >55. Younger patients have higher rates of GF due to alloimmune causes (P < 0.001); GF due to nonalloimmune causes are similar. F, GF from alloimmune and nonalloimmune causes stratified by diabetes as the cause of ESRD. Diabetics have higher rates of nonalloimmune GF (P = 0.002) but similar rates of alloimmune GF. BK, polyoma virus; DWFG, death with a functioning graft; ESRD, end-stage renal disease; GF, graft failure.

