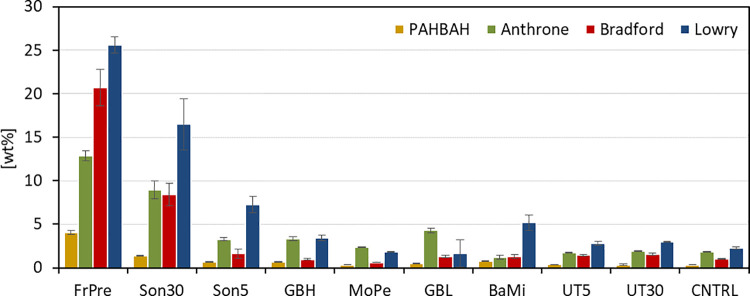
Fig 1. Comparison of physical treatments on the efficiency of cell disruption.
Depicts the amount of protein and carbohydrates (y-axis) found in the supernatant after each disruption method (x-axis). The values are relative to the initial biomass (wt%). Carbohydrate contents are displayed in yellow (PAHBAH) and green (Anthrone). Protein contents are displayed in red (Bradford) and blue (Lowry). FrPre: French press: 5 cycles with 20 mL microalgae/water suspension (10 g L-1). Son30/5: Sonication for 30/5 min with 10 mL microalgae/water suspension (10 g L-1). GBH/GBL: Wet milling with glass beads (1 mm diameter) and high/low (10 g L-1/1 g L-1) biomass loading. MoPe: Manually grinding with mortar and pestle for 5 min. BaMi: Dry milling with steal beads (5 mm diameter). UT5/30: Ultra turrax for 5/30 min with 10 mL microalgae/water suspension (10 g L-1). n = 3.

