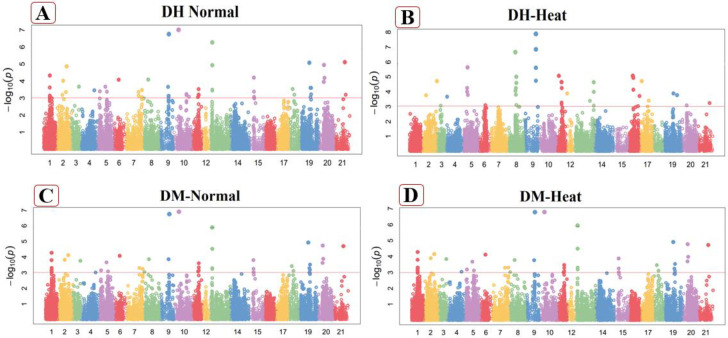
Fig 3.
Manhattan plot of Days to heading (DH) in normal (A), heat stressed (B) conditions and Days to maturity (DM) under normal (C), heat stressed (D) conditions. These figures exhibiting the position of significant SNPs and -log10(p) linked with specific traits in normal and heat stressed conditions.

