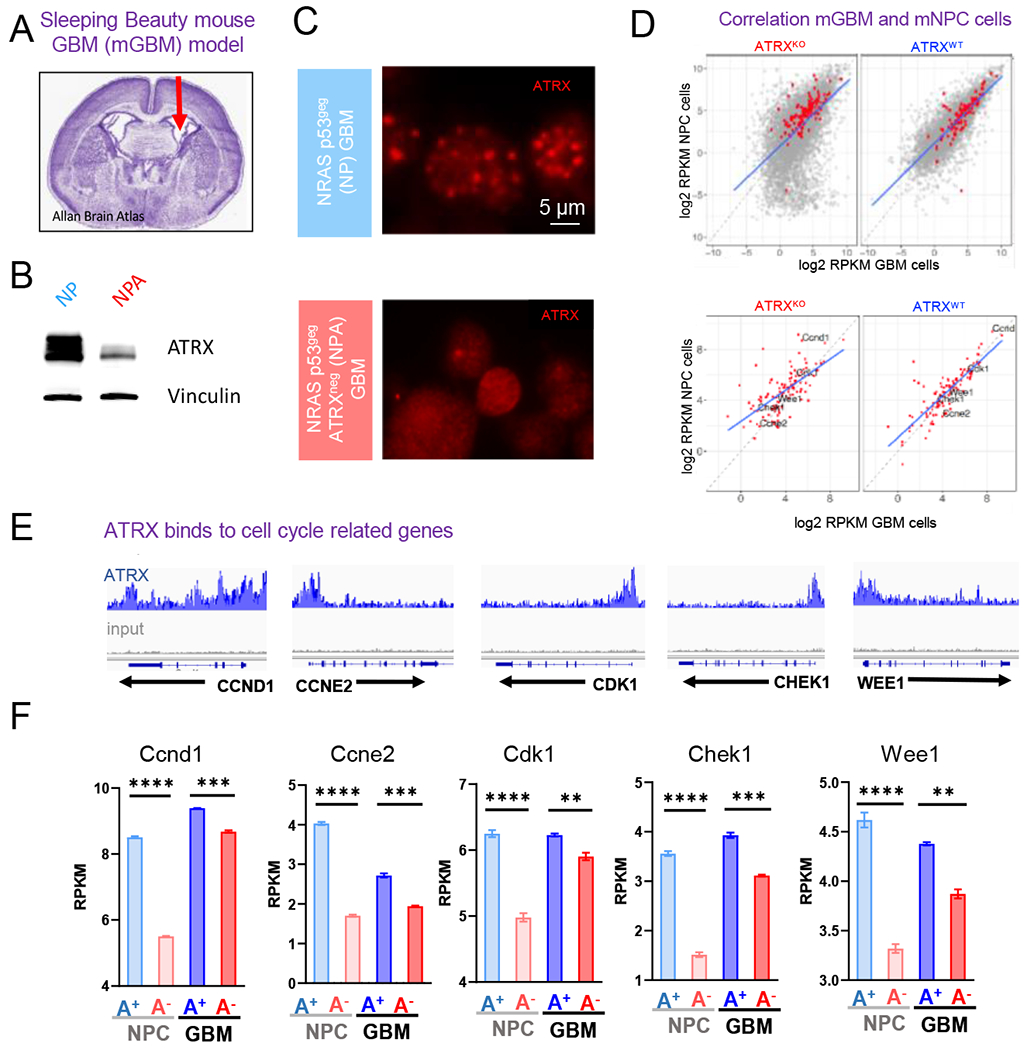
Figure 2. ATRX preferentially binds to genes involved in cell cycle processes in mNPCs and mGBMs.

(A) Mouse GBM neurospheres (“NP” and “NPA”) are generated from tumors harvested from mice who underwent neonatal implantation of plasmids injected in the lateral ventricle, denoted by the arrow in the H&E stained section of a mouse brain. (B-C) Western blot (B) and Immunocytochemistry (C) analysis of NP and NPA mGBM neurospheres illustrating the loss of ATRX. (D) Correlation of average gene expression (log2 RPKM) between mGBM cells and mNPC cells (TP53−/− ATRXpos and TP53−/− ATRXneg) stratified by ATRX status (ATRXKO vs. ATRXWT). Top: the correlation of genome-wide genes with KEGG cell cycle genes denoted in red; bottom: the correlation of KEGG Cell cycle genes. (E) ATRX ChIP-seq tracks (n=3) in mNPC cells demonstrate ATRX promoter binding (gray track is input). (F) Expression levels (RPKM) of select cell cycle regulatory genes (Ccnd1, Ccne2, Cdk1, Chek1 and Wee1) with isogenic loss of ATRX in mNPC and mGBM cells. [Mean ± SEM for triplicate experiments are shown. *P≤0.05, ****p≤0 0001 using Welch’s t-test.] For additional data, see also Figure S2 and Tables S1–4, 7)
