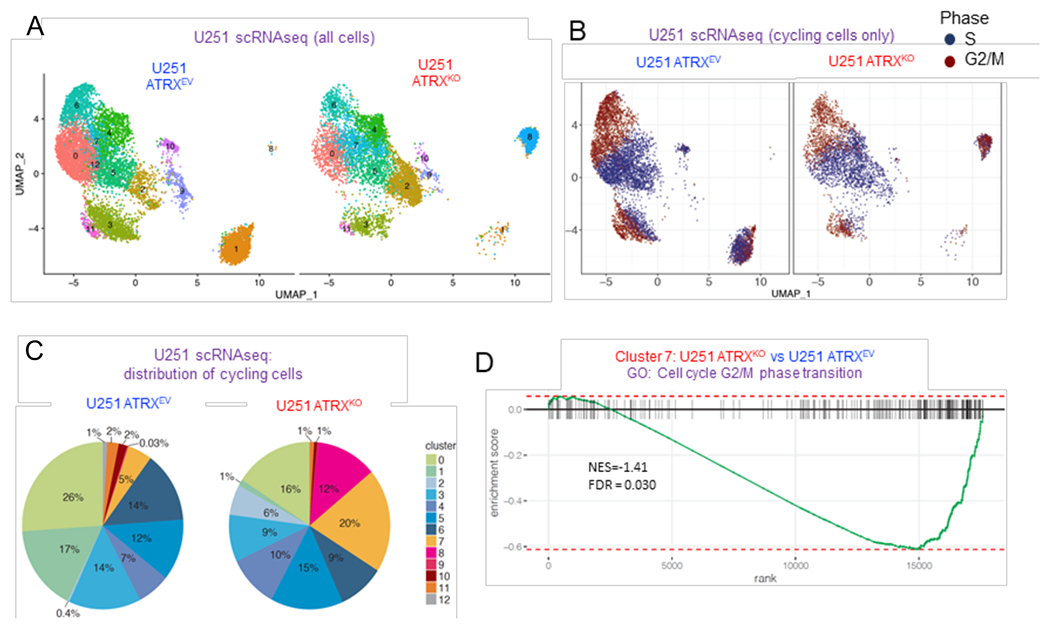
Figure 3. ATRX-deficient human glioma cells display changes in cell-cycle associated gene expression and an increase in S and G2/M cycling phase.

(A) UMAP visualization of cell clusters in U251-ARTXKO and U251-ARTXEV cells (number of PCs = 24). (B) UMAP visualization of cycling cells annotated by S (dark blue) or G2M (dark red) cycling phase. (C) Distribution of cycling cell proportion within each cluster in U251-ARTXKO and U251-ARTXEV cells respectively. (D) GSEA enrichment plot of GO term cell cycle G2/M phase transition that was significantly down-regulated in cluster 7 with the loss of ATRX. For additional data, see also Figure S3 and Tables S5–6.
