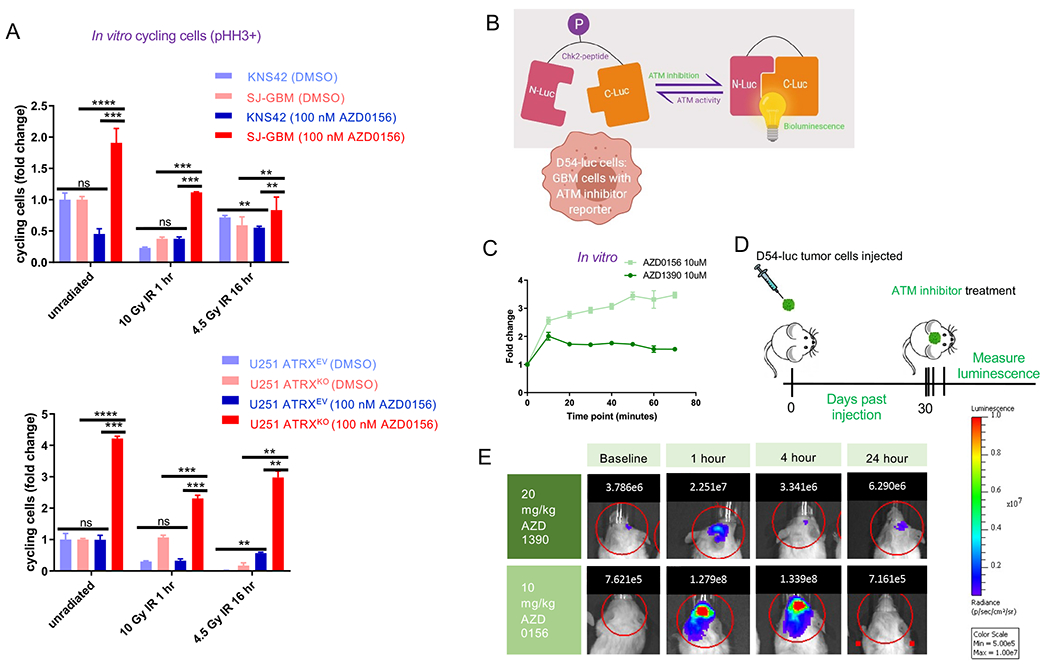
Figure 6. ATM inhibition results in selective increase in cell cycling in ATRX-deficient glioma cells and ATM-specific inhibition in vitro and in vivo.

(A) Flow cytometric cell cycle analysis [y-axis represents fold change in cycling cells, or percentage phospho-histone H3 (“pHH3”) positive] demonstrating selective increase in cycling cells with ATM inhibitor treatment in ATRX-deficient cells only. (B) Schematic of ATM inhibition reporter assay. (C) Graph depicting bioluminescence change compared to baseline after treatment with ATM inhibitor in D54 cells expressing ATM-Luciferase inhibition reporter in vitro (higher value represents more inhibition). Line represents mean ± SEM for triplicate experiments. (D) Schematic of in vivo D54-ATMR assay to assess in vivo intra-cranial on target changes with ATM inhibition. (E) Representative mice showing bioluminescence (photons) at various time points before and after treatment with ATM inhibitors. [Mean ± SEM for triplicate experiments are shown. *P≤0.05, **P≤ 0.01, ***P≤0.001, ****P≤0.0001 using Welch’s t-test.] For additional data, see also Figure S7.
