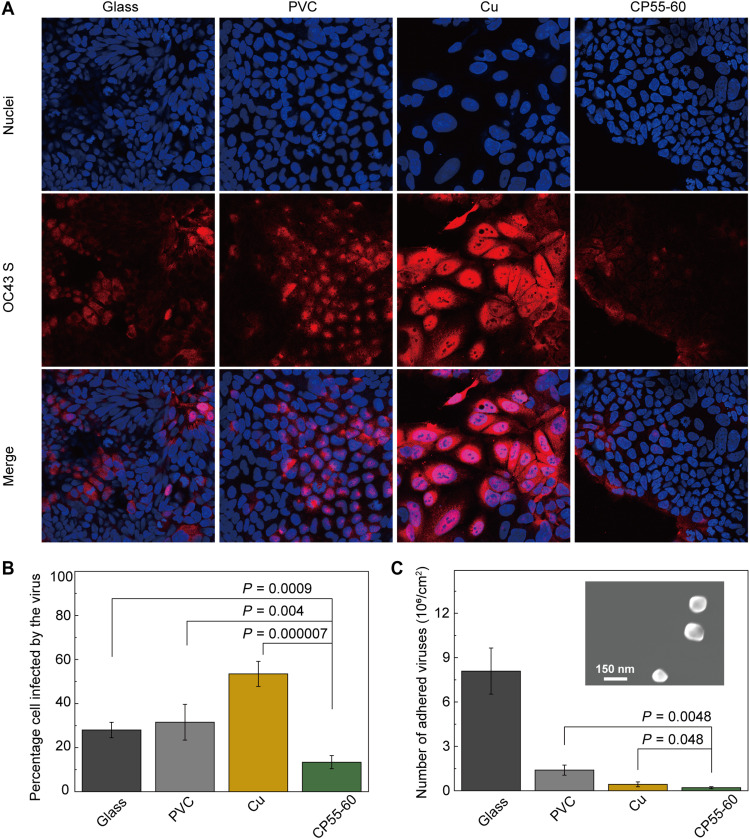
Fig. 3. Enhanced deactivation and repulsion of HCoV-OC43 on the imidazolium-based zwitterionic polymers.
(A) Immunofluorescence imaging of the HCoV-OC43-infected HCT-8 cells taken at 36 hours after infection on glass, PVC, Cu, and the CP55-60 coating. MOI of 0.05; HCoV-OC43 S. The spike protein in HCoV-OC43 was marked as red using primary anti–HCoV-OC43 S antibodies and Alexa Fluor 568–labeled goat anti-rabbit IgG, and cell nuclei were marked as blue using Hoechst 33358. (B) Percentage of cells infected by HCoV-OC43 that settled on the four surfaces, calculated by analyzing Fig. 3A using ImageJ. Data are shown as the means ± SD (n = 5); P values were calculated using Student’s t test. (C) Number of attached virus particles on glass, PVC, Cu, and CP55-60 surfaces counted from SEM images of each surface. Data are shown as the mean ± SD (n = 4); P values were calculated using Student’s t test. The inset shows a representative SEM image of surface-attached HCoV-OC43.

