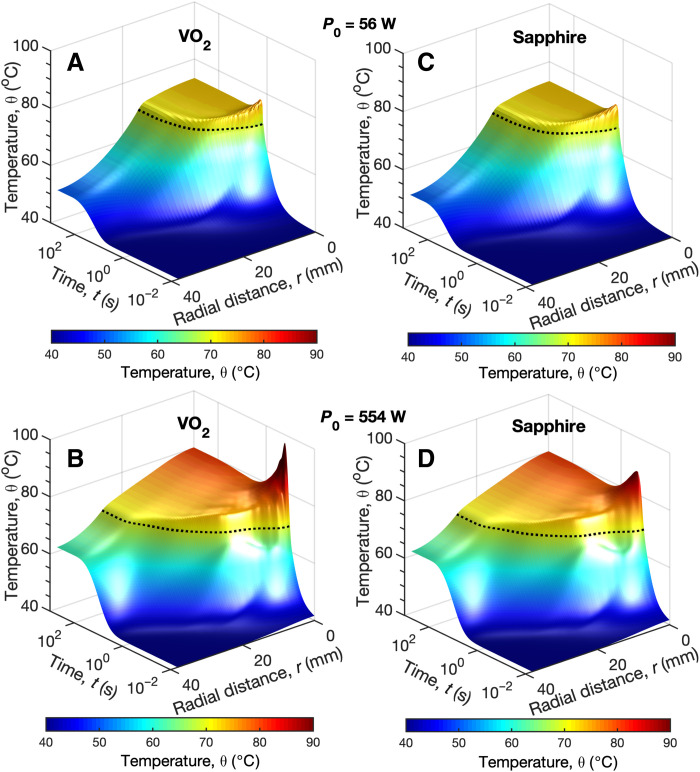
Fig. 6. Simulated temperature evolution of the VO2-on-sapphire wafer inside the photonic limiter under monochromatic excitation.
(A and B) Radial temperature distribution of the VO2 layer as a function of elapsed time t following excitation by a 95-GHz Gaussian beam with the waist radius r0 = 16.5 mm and input powers of 56 W (A) and 554 W (B). (C and D) the same for the opposite (uncoated) side of the sapphire wafer. The black dashed lines correspond to θc = 69° C.

