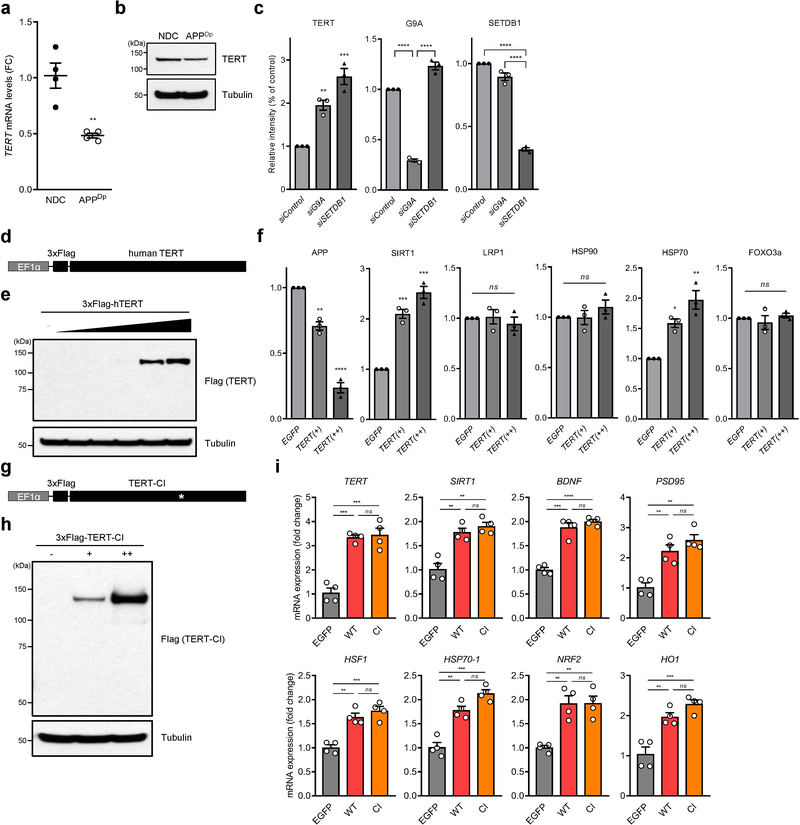
Extended Data Fig. 7: TERT levels in NDC- and APPDp-derived neurons, cloning of wild-type and catalytically inactive Flag-hTERT lentiviral vector and quantification of immunoblots shown in Fig.4.
a,b, TERT mRNA (a) and protein (b) levels in the neurons derived from NDC- and APPDp-derived iPSCs. c, Quantification of immunoblots in Fig. 4d. The values were normalized to respective control band intensity (n = 3; TERT: p = 0.0053, p = 0.0007, respectively, G9A: p < 0.0001, p < 0.0001, respectively, SETDB1: p < 0.0001, p < 0.0001, respectively). d, Schematic of wild-type Flag-tagged human TERT lentiviral expression construct. e, Immunoblots for the confirmation of 3xFlag-TERT expression in HEK293 cells. A tubulin was used as a loading control. Experiments were repeated three times independently with similar results. f, Quantification of immunoblots in Fig. 4g (n = 3 per group; APP: p = 0.0024, p < 0.0001, respectively, SIRT1: p = 0.0006, p = 0.0002, respectively, HSP70: p = 0.0228, p = 0.0037, respectively). Data are mean ± s.e.m. *P < 0.05, **P < 0.01, ***P < 0.001, ****P < 0.0001; ns, not significant (two-tailed unpaired t-test (a) or two-way ANOVA with Tukey’s multiple comparisons test (c,f)). g, Schematic of catalytically inactive (CI) human TERT lentiviral expression construct. The white asterisk indicates the position of the single mutation D712A, which renders the protein catalytically inactive. h, Immunoblots for the confirmation of Flag-tagged catalytically inactive TERT expression in HEK293 cells. A tubulin was used as a loading control. Experiments were repeated three times independently with similar results. i, mRNA expression levels of each gene indicated in EGFP-, wildtype (WT) TERT- or catalytically inactive (CI) TERT-transduced APPDp neurons (n = 4; EGFP vs. WT and EGFP vs. CI: TERT: p = 0.0003, p = 0.0003, respectively, SIRT1: p = 0.0031, p = 0.0014, respectively, BDNF: p = 0.0001, p < 0.0001, respectively, PSD95: p = 0.0081, p = 0.0021, respectively, HSF1: p = 0.0014, p = 0.0005, respectively, HSP70–1: p = 0.0041, p = 0.0006, respectively, NRF2: p = 0.0053, p = 0.0052, respectively, HO1: p = 0.0024, p = 0.0005, respectively). Transcript levels were normalized to HPRT1 mRNA. Data are mean ± s.e.m. **P < 0.01, ***P < 0.001, ****P < 0.0001; ns, not significant (two-way ANOVA with Tukey’s multiple comparisons test)

