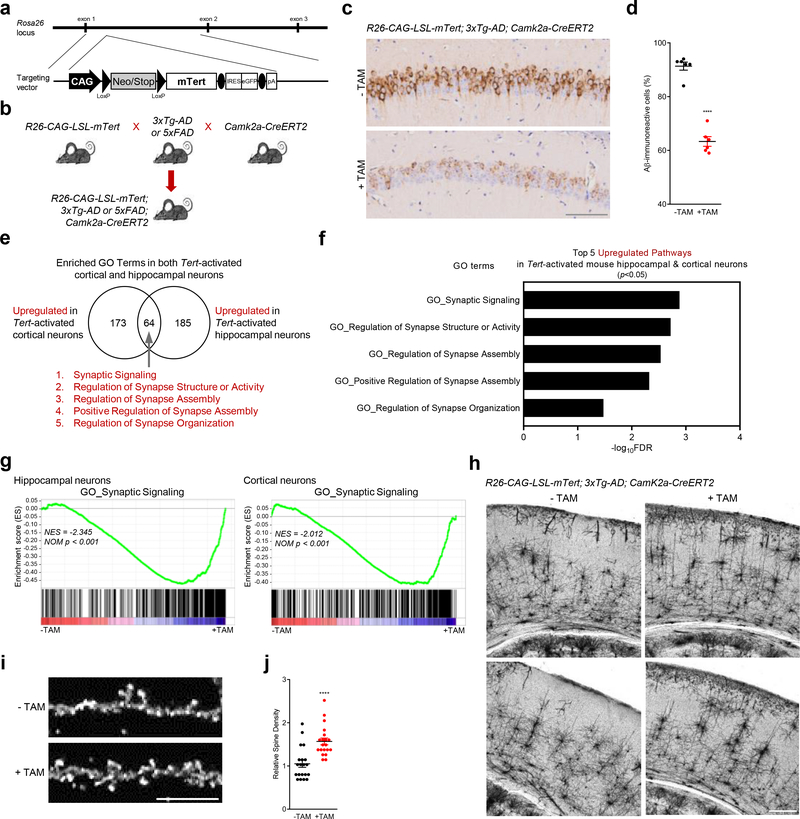
Fig. 3. TERT activation not only alleviates amyloid pathology but enhances synaptic pathways and neural networks in AD mouse model.
a, Targeting strategy for the generation of CAG-LSL-mTert-IRES-eGFP-polyA knock-in mice. b, Breeding strategy of R26-CAG-LSL-mTert with 3xTg-AD or 5xFAD and Camk2a-CreERT2 mice. c, Aβ immunostaining in the CA1 hippocampal subfield of adult (8-month-old) control and Tert-activated R26-CAG-LSL-mTert; 3xTg-AD; Camk2a-CreERT2 mice. Scale bar, 100 μm. d, Quantitative comparison of Aβ-immunoreactive pyramidal neurons in the CA1 regions (n = 6 per group, 8-month-old; p < 0.0001, two-way ANOVA with Tukey’s multiple comparisons test). e, Venn diagram showing intersections of upregulated biological processes based on the RNA-Seq results from Tert-activated cortical and hippocampal neurons of R26-CAG-LSL-mTert; 3xTg-AD; Camk2a-CreERT2 mice compared with control groups. f, Top 5 overlapping pathways upregulated in both Tert-activated cortical and hippocampal neurons. g, Gene Set Enrichment Analysis (GSEA) plots showing relative upregulation of synaptic signaling genes in Tert-activated cortical and hippocampal neurons by comparison with control neurons. GSEA was based on the two-sided Kolmogorov-Smirnov statistic, and nominal p values unadjusted for multiple comparisons were calculated from 1,000 iterations of permutation on sample labels. h, Representative images of Golgi-stained cortical neurons from aged (18 months) control and Tert-activated R26-CAG-LSL-mTert; 3xTg-AD; Camk2a-CreERT2 mice (n = 4 independent biological replicates per group). Experiments were repeated four times independently with similar results. Scale bar, 250 μm. i, High magnification of dendritic spines in impregnated pyramidal cortical neurons of aged control and Tert-activated R26-CAG-LSL-mTert; 3xTg-AD; Camk2a-CreERT2 mice. Scale bar, 10 μm. j, Quantification of dendritic spine density (n = 5 dendrites per mouse, n = 4 mice per group, 18-month-old; p < 0.0001, two-tailed unpaired t-test). Data are mean ± s.e.m. ****P < 0.0001.

