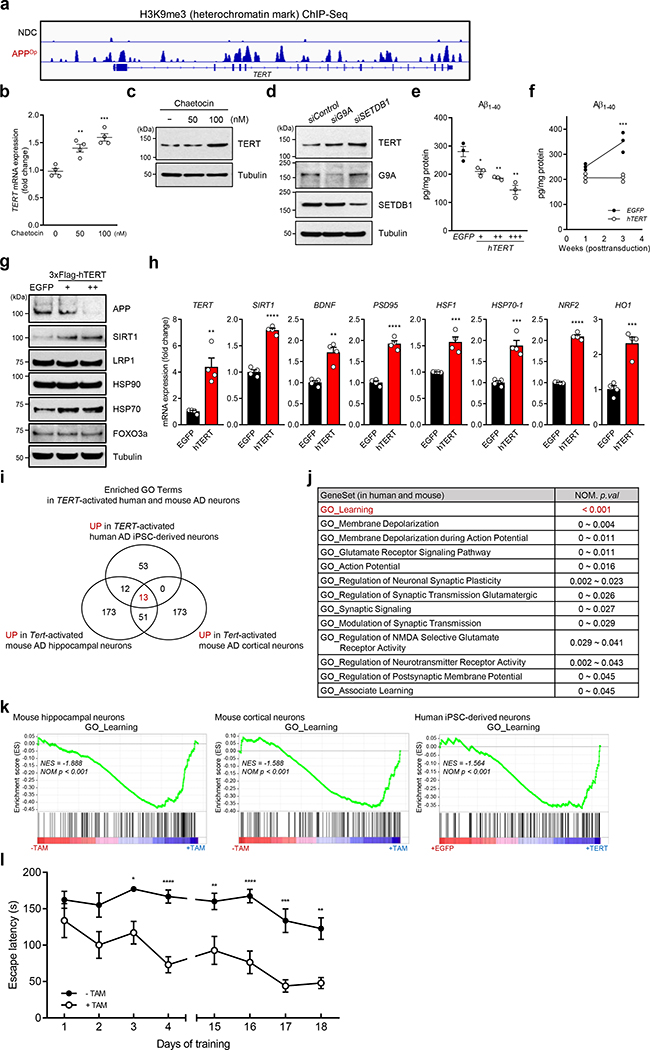
Fig. 4. TERT activation alleviates amyloid pathology in human iPSC-derived neurons and ameliorates learning and memory deficits in AD.
a, H3K9me3 repressive histone mark occupancy in TERT gene of neurons from APPDp patient- and non-demented control (NDC) individual-derived iPSCs. b, c, TERT mRNA levels (b, n = 4; 0 vs. each concentration: p = 0.0038, p = 0.0005, respectively, two-way ANOVA with Tukey’s multiple comparisons test) and TERT protein levels (c) in chaetocin-treated human iPSC-derived APPDp neurons. d, TERT protein levels in human iPSC-derived APPDp neurons treated with siRNAs targeting histone methyltransferase genes, G9A or SETDB1 (n = 3 independent biological replicates per group). e, f, Aβ1–40 levels measured by ELISA in EGFP- or TERT-transduced iPSC-derived APPDp neurons (n = 3; EGFP vs. hTERT: p = 0.0251, p = 0.007, p = 0.0049, respectively, two-tailed unpaired t-test (e) and week 3: p = 0.0001, two-way ANOVA with Sidak’s multiple comparisons test (f)). g, Immunoblots for the indicated endogenous proteins in EGFP- or TERT-transduced iPSC-derived APPDp neurons (n = 3 independent biological replicates per group). h, Relative gene expression by qRT-PCR in EGFP- or TERT-transduced iPSC-derived APPDp neurons (n = 4; EGFP vs. hTERT: p = 0.0025, p < 0.0001, p = 0.0013, p < 0.0001, p = 0.001, p = 0.0005, p < 0.0001, p = 0.0006, respectively, two-tailed unpaired t-test). i, Venn diagram showing intersections of upregulated biological processes based on three (3) independent RNA-Seq results from Tert-activated mouse cortical and hippocampal neurons of R26-CAG-LSL-mTert; 3xTg-AD; Camk2a-CreERT2 mice (n = 4 for each group) and TERT-activated human iPSC-derived APPDp neurons (n = 3) compared with each control group (all p < 0.05). j, List of 13 overlapping pathways upregulated in all Tert-activated mouse cortical and hippocampal AD neurons and TERT-activated human iPSC-derived APPDp neurons. k, GSEA plots showing relative upregulation of learning-related genes in Tert-activated cortical and hippocampal AD neurons and TERT-activated human iPSC-derived APPDp neurons by comparison with each control group. GSEA in i-k was based on the two-sided Kolmogorov-Smirnov statistic, and nominal p values unadjusted for multiple comparisons were calculated from 1,000 iterations of permutation on sample labels. l, Escape latency of aged (22~26 months) control and Tert-activated R26-CAG-LSL-mTert; 3xTg-AD; Camk2a-CreERT2 mice in the Barnes maze over training days (n = 9 for each group; day 3: p = 0.0251, day 4: p < 0.0001, day 15: p = 0.0078, day 16: p < 0.0001, day 17: p = 0.0001, day 18: p = 0.0022, two-way ANOVA with Sidak’s multiple comparisons test). Experiments in d and g were repeated three times independently with similar results. Data are mean ± s.e.m. *P < 0.05, **P < 0.01, ***P < 0.001, ****P < 0.0001.

