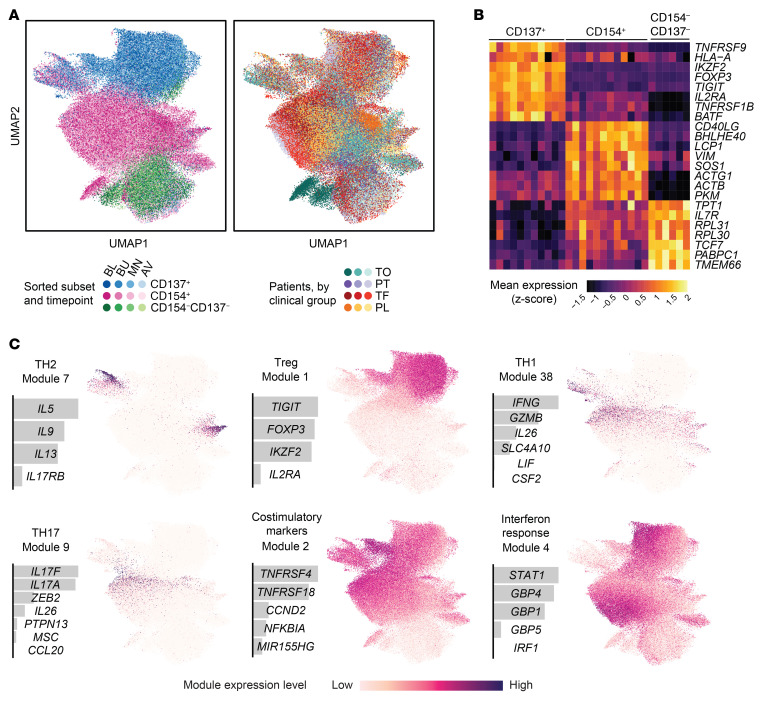
Figure 2. Peanut-reactive T cells from patients undergoing OIT have diverse and distinct transcriptional signatures.
(A) 2D UMAP visualization of all single-cell transcriptomes (n = 134,129 cells), colored by sorted subset and time point (left) and by patient and clinical group (right). (B) Top differentially expressed genes between the sorted subsets. Each column represents the scaled average gene expression of cells from a single patient. Genes were selected using a receiver operating characteristic (ROC) test. (C) Selected gene modules discovered using sparse PCA, labeled with module number and a proposed descriptor. For each module, the relative weights of each contributing gene and the module score of all cells overlaid on the UMAP coordinates are shown.

